Open Access
Fig. 6
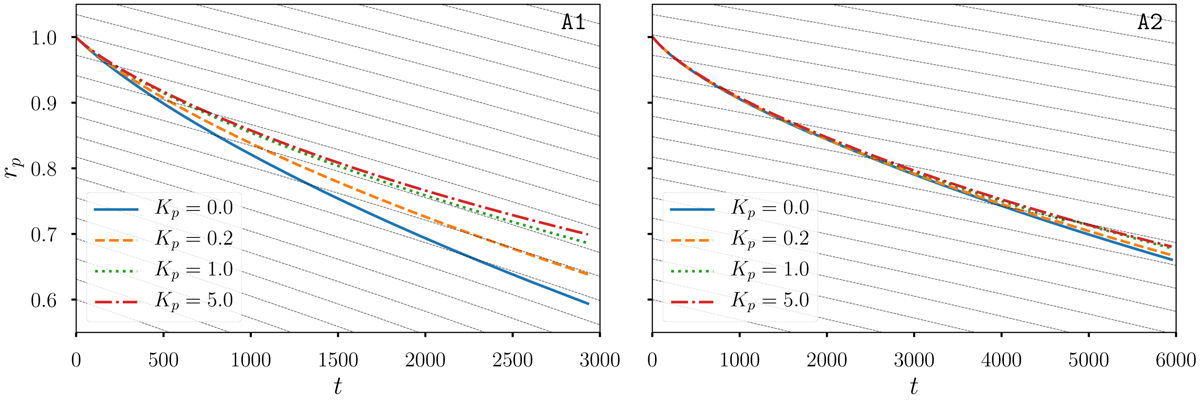
Radial position of the planet rp VS time, forvarying accretion rates. Panels correspond to simulation sets A1 (left panel) and A2 (right panel). The plot includes analytical migration tracks Eq. (11) with varying time offsets as guidelines.
Current usage metrics show cumulative count of Article Views (full-text article views including HTML views, PDF and ePub downloads, according to the available data) and Abstracts Views on Vision4Press platform.
Data correspond to usage on the plateform after 2015. The current usage metrics is available 48-96 hours after online publication and is updated daily on week days.
Initial download of the metrics may take a while.