Fig. 4
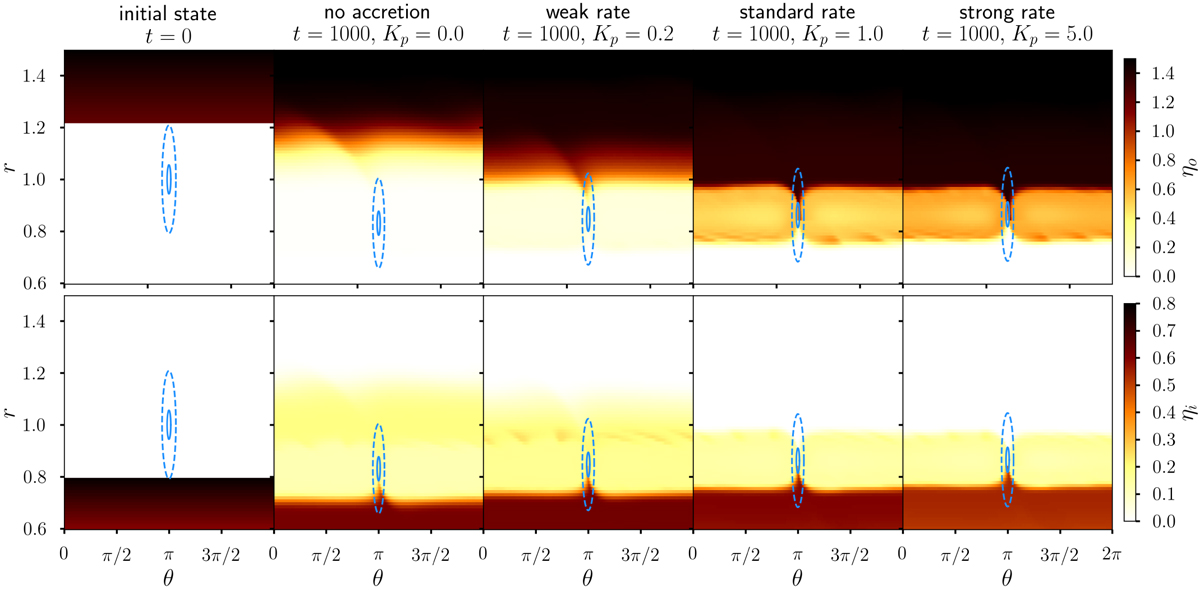
Evolution of passive tracers ηi∕o for simulation set A1, following material originated in the outer (top panels)/inner (bottom panels) disk, in polar coordinates. Left panel: initial state (white is 0). All but leftmost column: 1000 orbits after release, for varying values of Kp. We emphasize that color scales are different across rows. For the sake of readability, the disk is here displayed with angular coordinates such that θp = π in every frame. Filled lines show the planet’s feeding zone, 0.8RH in radius; dashed lines are 3RH large in radius, encompassing a somewhat broader region than the typical HSR.
Current usage metrics show cumulative count of Article Views (full-text article views including HTML views, PDF and ePub downloads, according to the available data) and Abstracts Views on Vision4Press platform.
Data correspond to usage on the plateform after 2015. The current usage metrics is available 48-96 hours after online publication and is updated daily on week days.
Initial download of the metrics may take a while.