Fig. B.2
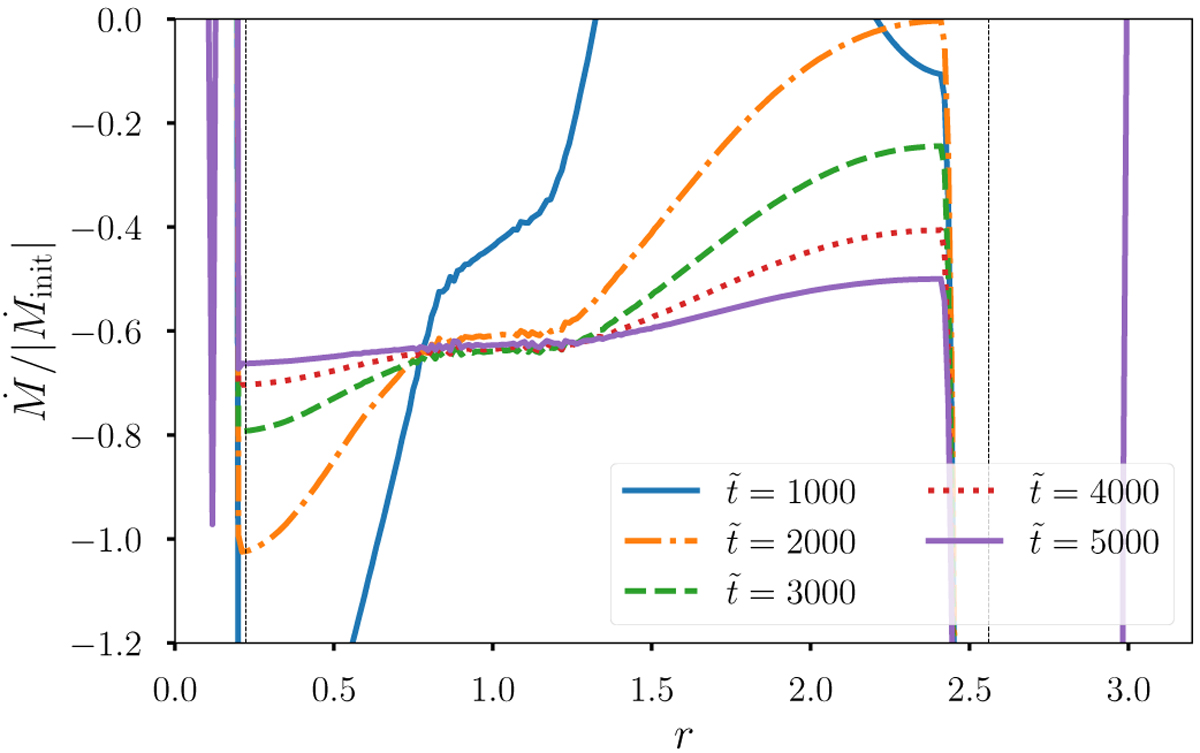
Relaxation of the azimuthaly averaged radial flow, case A1. ![]() denotes time during introduction and relaxation stages (
denotes time during introduction and relaxation stages (![]() ). Limits of the domain of interest (excluding wave-killing zones) are shown as dashed lines. Ṁinit denotes the uniform value in the analytic state of the unperturbed disk described in Sect. 2. 628 snapshots covering oneorbit were averaged to obtain each line in this figure.
). Limits of the domain of interest (excluding wave-killing zones) are shown as dashed lines. Ṁinit denotes the uniform value in the analytic state of the unperturbed disk described in Sect. 2. 628 snapshots covering oneorbit were averaged to obtain each line in this figure.
Current usage metrics show cumulative count of Article Views (full-text article views including HTML views, PDF and ePub downloads, according to the available data) and Abstracts Views on Vision4Press platform.
Data correspond to usage on the plateform after 2015. The current usage metrics is available 48-96 hours after online publication and is updated daily on week days.
Initial download of the metrics may take a while.