Fig. 6.
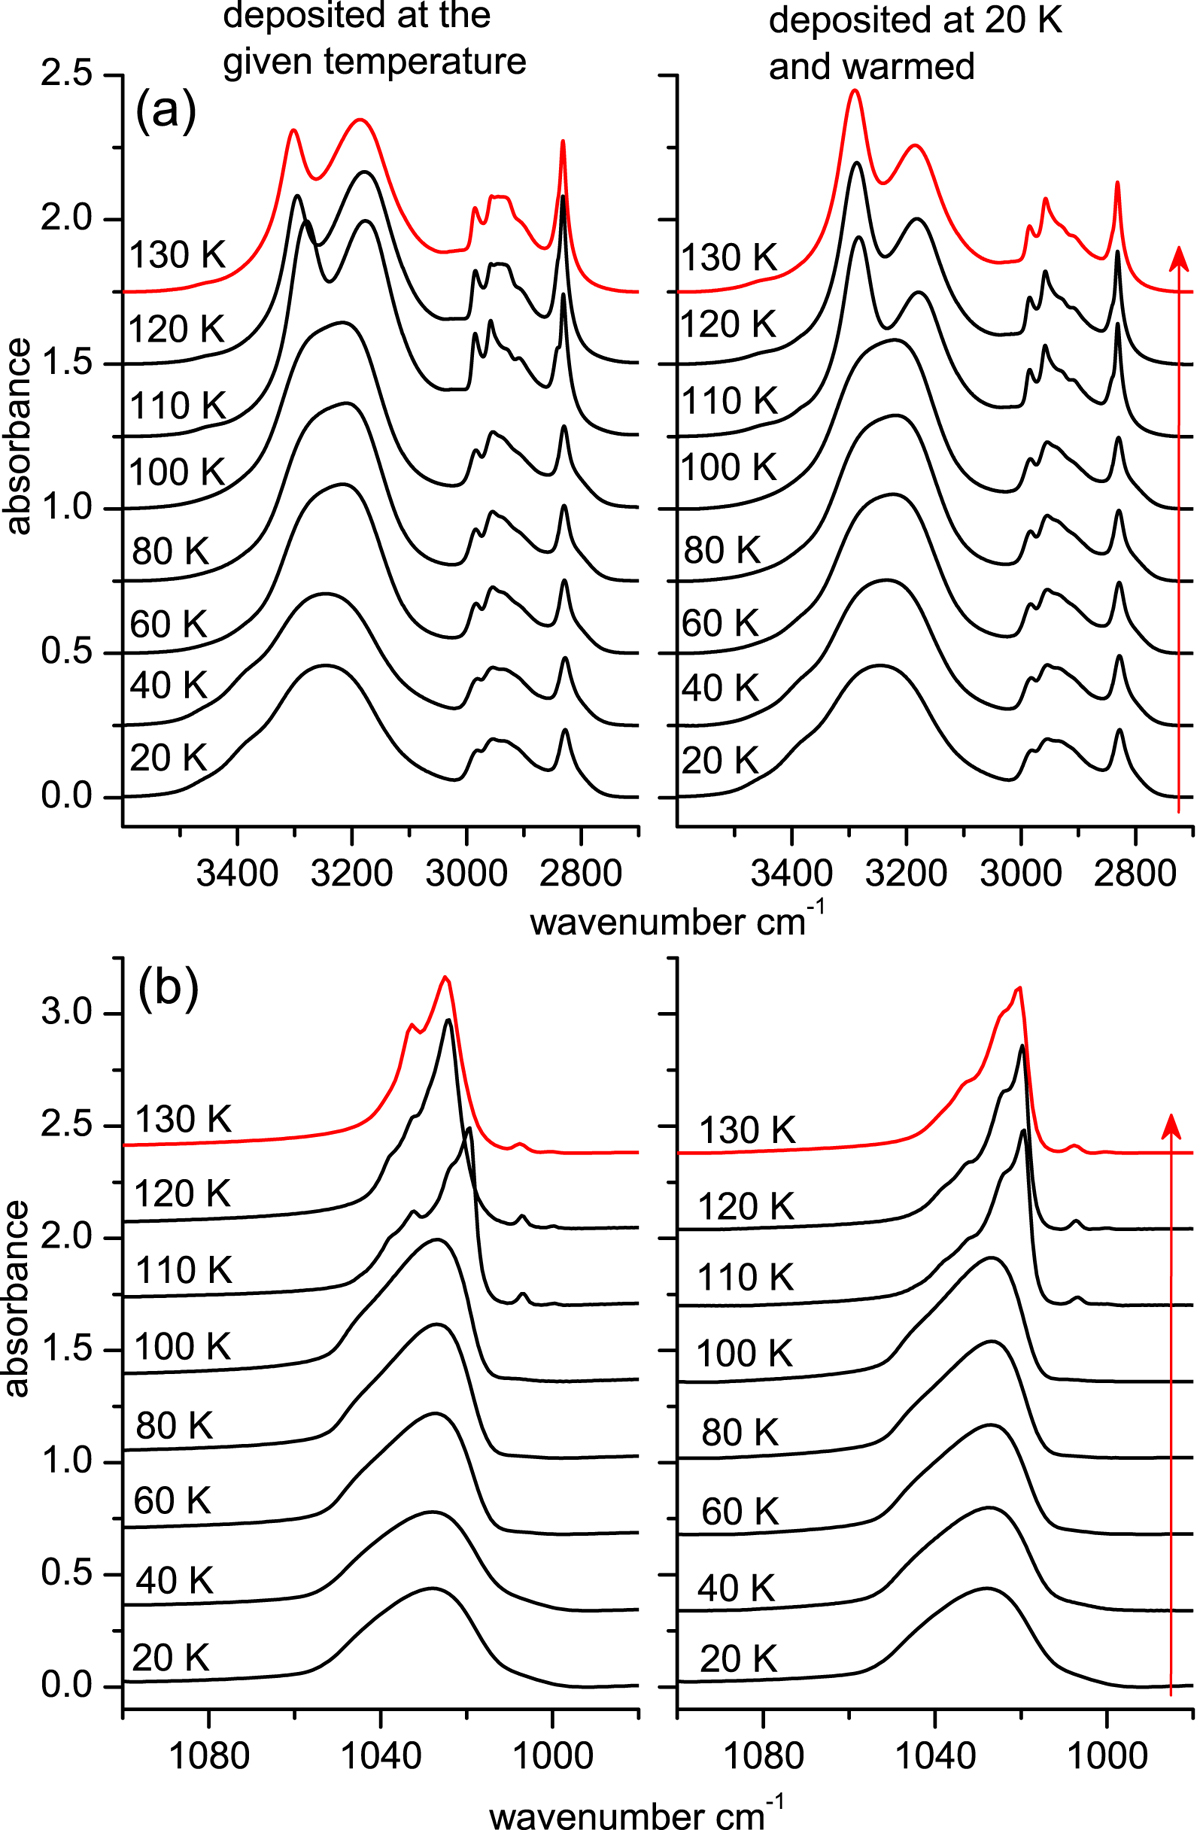
Infrared spectra of methanol ices grown at the indicated temperatures (left panels) or grown at 20 K and annealed to the indicated temperatures (right panels). Appropriate baselines have been subtracted. The spectra correspond to layers about 990 nm thick. Vertical offsets have been added to the absorbance spectra for clarity in the representation.
Current usage metrics show cumulative count of Article Views (full-text article views including HTML views, PDF and ePub downloads, according to the available data) and Abstracts Views on Vision4Press platform.
Data correspond to usage on the plateform after 2015. The current usage metrics is available 48-96 hours after online publication and is updated daily on week days.
Initial download of the metrics may take a while.