Fig. 9
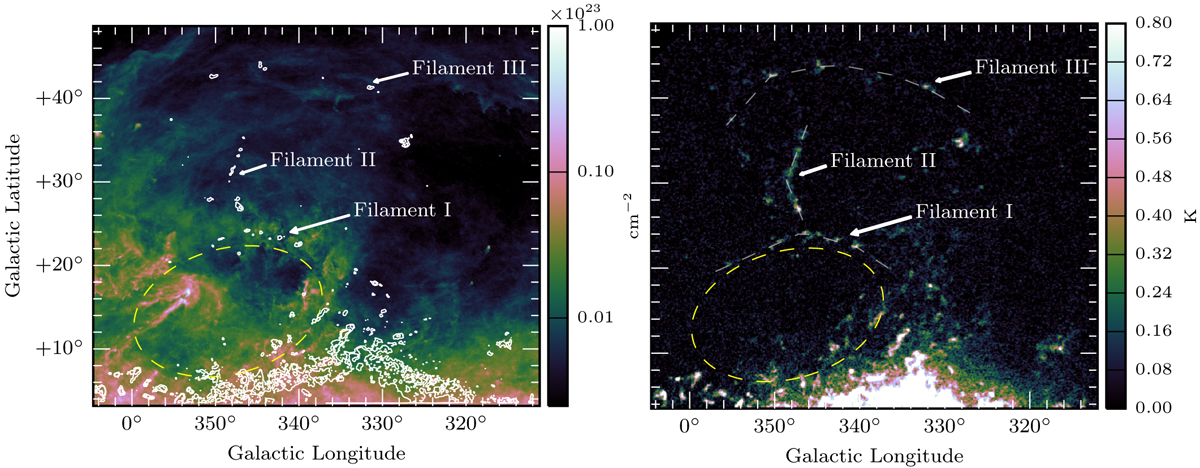
Left panel: GASS data showing the HI emission at VLSR = −95.64 km s−1 with white contours. The contour levels are at 3.0 and 6.0 K. The background colour scale is the total gas column density NH. The yellow dashed ellipse delimits the edges of the bubble as seen in Fig. 2. Right panel: HI emission map at VLSR = −95.64 km s−1. The white dashed lines represent the slices used to produce the velocity-position plots in Fig. 10.
Current usage metrics show cumulative count of Article Views (full-text article views including HTML views, PDF and ePub downloads, according to the available data) and Abstracts Views on Vision4Press platform.
Data correspond to usage on the plateform after 2015. The current usage metrics is available 48-96 hours after online publication and is updated daily on week days.
Initial download of the metrics may take a while.