Fig. 2
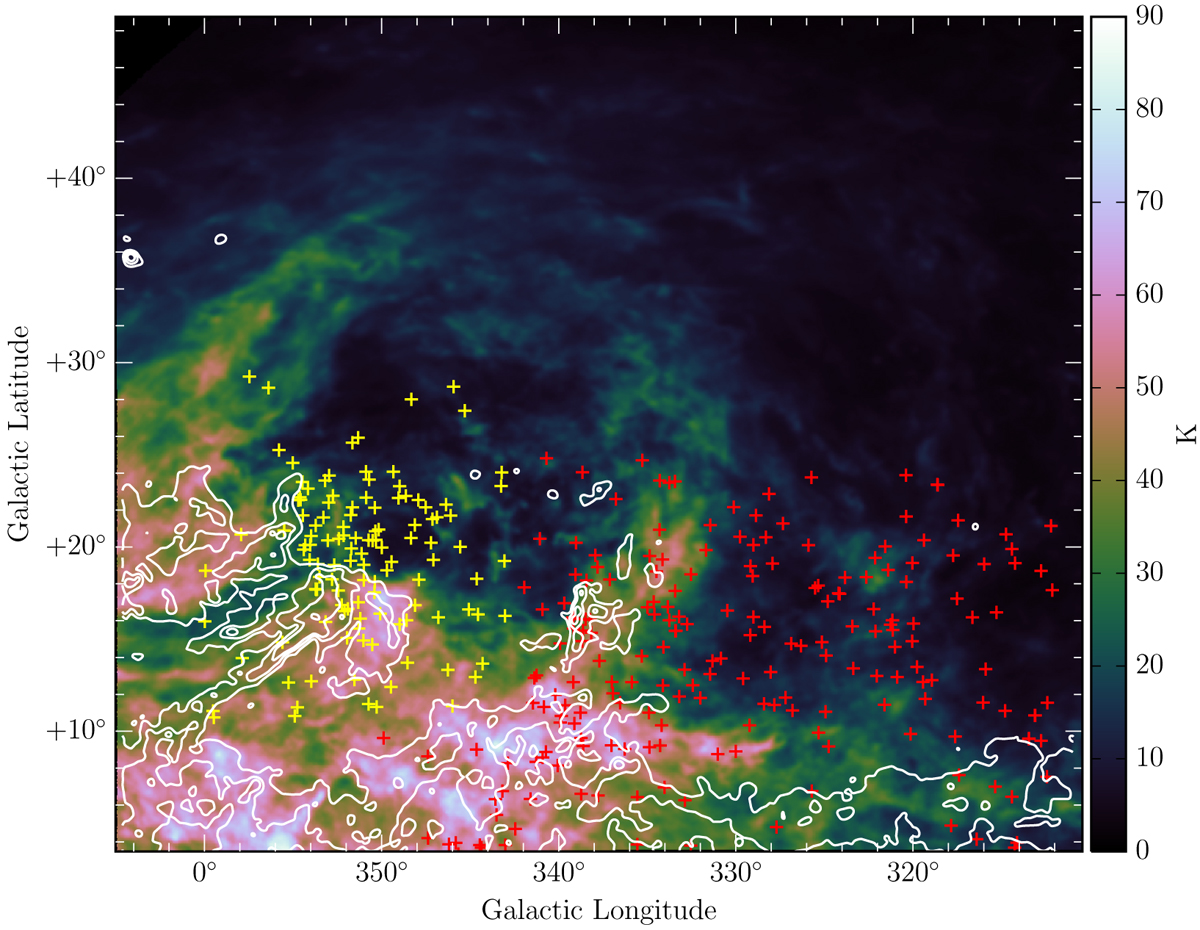
USco HI shell at VLSR = 5.77 km s−1 from GASS HI data. The white contours represent the NH map smoothed with a 5-pixel σ Gaussian kernel, where the contour levels are at 2.5, 4.5, and 8.0 × 1021 cm−2. The yellow and red crosses show the position of the USco and UCL subgroups, respectively, according to the hipparcos catalogue (de Zeeuw et al. 1999).
Current usage metrics show cumulative count of Article Views (full-text article views including HTML views, PDF and ePub downloads, according to the available data) and Abstracts Views on Vision4Press platform.
Data correspond to usage on the plateform after 2015. The current usage metrics is available 48-96 hours after online publication and is updated daily on week days.
Initial download of the metrics may take a while.