| Issue |
A&A
Volume 617, September 2018
|
|
|---|---|---|
| Article Number | A88 | |
| Number of page(s) | 6 | |
| Section | Stellar structure and evolution | |
| DOI | https://doi.org/10.1051/0004-6361/201833305 | |
| Published online | 21 September 2018 | |
Detection of a 23.6 min periodic modulation in the optical counterpart of 3XMMJ051034.6–670353
1
Armagh Observatory and Planetarium, College Hill, Armagh, BT61 9DG, UK
e-mail: This email address is being protected from spambots. You need JavaScript enabled to view it.
2
Department of Physics, University of Warwick, Coventry, CV4 7AL, UK
3
Division of Physics, Mathematics and Astronomy, California Institute of Technology, Pasadena, CA 91125, USA
4
Department of Physics & Astronomy, University of Sheffield, Sheffield, S3 7RH, UK
5
Instituto de Astrofísica de Canarias, 38205 La Laguna, Tenerife, Spain
6
Inter-University Institute for Data Intensive Astronomy, Department of Astronomy, University of Cape Town, Private Bag X3, Rondebosch, 7701 South Africa
7
Department of Astrophysics/IMAPP, Radboud University, PO Box 9010, 6500 GL, Nijmegen, Netherlands
Received:
25
April
2018
Accepted:
7
June
2018
Abstract
We present high speed optical photometric observations made using the NTT and ULTRACAM of the optical counterpart of 3XMMJ051034.6–670353, which was recently identified as an X-ray source showing a modulation on a period of 23.6 min. Although the optical counterpart is faint (g = 21.4), we find that the u′g′r′ light curves show a periodic modulation on a period which is consistent with the X-ray period. We also obtained three low resolution spectra of 3XMMJ051034.6–670353 using the Gemini South Telescope and GMOS. There is no evidence for strong emission lines in the optical spectrum of 3XMMJ051034.6–670353. We compare and contrast the optical and X-ray observations of 3XMMJ051034.6–670353 with the ultra compact binaries HM Cnc and V407 Vul. We find we can identify a distribution of binary masses in which stable direct impact accretion can occur.
Key words: accretion, accretion disks / binaries: close / novae, cataclysmic variables / X-rays: stars
© ESO 2018
1. Introduction
Twenty years ago, two X-ray sources were discovered during the course of the ROSAT All-Sky Survey which showed a characteristic “on/off” flux profile which were modulated on a period of 321 s (RX J0806+15, Israel et al. 1999) and 569 s (RX J1914+24, Motch et al. 1996). The optical counterparts were found to show a modulation on the same period as the X-ray flux (HM Cnc: Ramsay et al. 2002; Israel et al. 2002; V407 Vul: Ramsay et al. 2000). It was later found that the peak of the X-ray and optical flux profile in both systems is shifted by ~0.2 cycles (Barros et al. 2007). Because of their faintness (both V ~ 20), and their short period, it took some time to confirm that the observed 321 s period seen in HM Cnc was the binary orbital period (Roelofs et al. 2010) and therefore the most compact known binary star. Today, HM Cnc and V407 Vul are still the two most compact stellar binary systems known.
HM Cnc and V407 Vul are at the very short period end of the orbital period distribution of “AM CVn” binaries (5–70 min). They consist of two degenerate (or semi-degenerate) stars orbiting around a common centre of gravity (see Solheim 2010 for a review). As the less massive secondary star fills its Roche Lobe, material flows from the secondary star towards the more massive star. In the case of HM Cnc and V407 Vul, it is still an open question as to whether the material from the mass donor forms a small accretion disc or that accretion occurs through “direct impact” (Marsh & Steeghs 2002) or magnetic accretion (Cropper et al. 1998; Barros et al. 2007), although the radial velocity study of Roelofs et al. (2010) seems to favour the direct impact scenario in HM Cnc. It is thought that a small fraction of AM CVn’s may result in a merger and potentially a SN 1a or .1a explosion (see Kilic et al. 2014). They are predicted to be the brightest known sources of persistent gravitational waves and are “verification” sources for any space-based gravitational wave observatory such as LISA (e.g. Nelemans 2013; Korol et al. 2017).
Currently there are 52 known AM CVn binaries, but none have similar characteristics to HM Cnc or V407 Vul. For instance, ES Cet, with an orbital period of 620 s (Warner & Woudt 2002), only a little longer than V407 Vul’s period, has very different photometric properties and accretes via a disc. This suggests that sources like HM Cnc and V407 Vul are rare, perhaps because the direct impact phase lasts a short time (a few million years or less). Given the great interest in these sources from the gravitational wave community (amongst others) it is of great interest to find more examples of these ultra-short period binaries.
A recently discovered X-ray source (3XMMJ051034.6– 670353, XMMJ0510–67 for brevity) in the XMM-Newton EXTraS survey (Haberl et al. 2017). shows an X-ray modulation on a period of 23.6 min and an on/off X-ray light curve very similar to HM Cnc and V407 Vul but with a lower flux. The fact that the most likely optical counterpart is faint (g = 21.3, Haberl et al. 2017) has made it difficult to determine if the optical flux is modulated on the same period as the X-ray period.
In this paper, we present ULTRACAM photometric observations made using the ESO NTT which show that the optical counterpart of XMMJ0510–67 also shows period variability on a timescale of 23.6 min (Sect. 2). In Sect. 3 we present an optical spectrum of XMMJ0510–67 obtained from the Gemini South Telescope. In Sect. 4 we outline the possible interpretation of these observations and their implications.
2. ULTRACAM photometric observations
Observations of XMMJ0510–67 were made using the ULTRACAM multi-band imager which is a visitor instrument at ESO’s 3.5 m New Technology Telescope (NTT) on La Silla, Chile. ULTRACAM has essentially zero readout time and allows fast simultaneous three-colour photometric measurements of faint targets (Dhillon et al. 2007). Observations started on 2017 Nov. 22 at 02:42 UT and lasted 4.04 h. Conditions were clear and seeing was ~1.0″. The exposure time for the g′ (~4000–5500 Å) and r′ (5500–6900 Å) bands were 20 s each, and 60 s in the u′ band (3600–3900 Å).
In Fig. 1 we show the co-added g band 1′ × 1′ image centred on XMMJ0510–67. Although the field is out of the Galactic plane (b = − 34.6°), it is quite crowded and a slightly brighter star (g′ = 21.0) is only 1.8″ from XMMJ0510–67 (Haberl et al. 2017). Haberl et al. (2017) also show that XMMJ0510–67 has a colour g − r = –0.03 ± 0.02. Comparing stars in the field with the Skymapper uv band magnitudes (Scalzo et al. 2017) we estimate that XMMJ0510–67 gives u − g ~ 0.1–0.2, where the uncertainty stems from the inexact relationship between the ULTRACAM u′ filter and the Skymapper passbands.
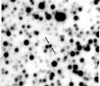 |
Fig. 1. Co-added g′ band image of the field surrounding XMMJ0510– 67 (which is marked by two arrows and is source “1” in Fig 9 of Haberl et al. 2017). It was made from all 727 g′ band images each with an exposure of 20 s. The image is 1 × 1 arcmin across with North being to the top and East to the left. We estimate the depth of the image reaches g′ ~ 23.6. |
For the g′ and r′ data we used the profile fitting package psfex (Bertin 2011). There were significantly fewer stars in the u′ band image and XMMJ0510–67 was faint and we used standard fixed aperture photometry using autophotom (Eaton et al. 2009). For the g′ and r′ data we compared the magnitudes of all stars in each image with that derived from the coadded frame made from the five images with the best seeing. We used the brighter stars to determine an offset between each image and the coadded image to derive the relative brightness of all stars in the field. We also detrended all light curves by subtracting a low order polynomial. We obtained the Lomb Scargle power spectrum for each light curve (both before and after detrending): XMMJ0510–67 stood out as being variable on a period of ~23.6 min in both the g′ and r′ data (both before and after detrending). We show the g′ and r′ band light curves for XMMJ0510–67 in the left hand panels of Fig. 2 and the Lomb Scargle periodogram in the right hand panels of Fig. 2. For the u′ band images we obtained a light curve of XMMJ0510–67 by obtaining differential photometry with nearby comparison stars. The star 1.8″ to the East of XMMJ0510–67 shows no evidence of periodic variability.
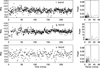 |
Fig. 2. Left-hand panels: light curve of XMMJ0510–67 made using the NTT and ULTRACAM in the r′ band (upper), g′ band (middle) and u′ band (lower) and normalised so the mean magnitude is 0.0. Right-hand panels: Lomb-Scargle periodogram of the light curves shown in the left hand panels. |
We performed a least-squares fit to the light curves using a sinusoid to determine the uncertainty of the period (from the covariance matrix) and we show these in Table 1. The periods in all three optical bands are consistent to within <3σ with the X-ray period (23.63 ± 0.02 min, Haberl et al. 2017). We folded the light curves on a period of 23.6 min and show these in Fig. 3. The semi-amplitude of the modulation is ~0.08–0.10 mag at u′g′r′ bands: this is lower than HM Cnc (a semi-amplitude of ~0.15 mag) and also the u band amplitude observed in V407 Vul (Barros et al. 2007). In the non-detrended light curves, there is some evidence for a longer period trend (especially in the g′ band). Further observations are required to determine if this is intrinsic to the source or perhaps a colour effect.
Period and amplitude of the modulation in the detrended u′g′r′ light curves of XMMJ0510–67.
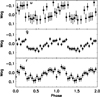 |
Fig. 3. Light curves of XMMJ0510–67 in the u′g′r′ filters folded on a period of 23.63 min and To = HMJD 58079.112. |
3. Gemini spectroscopic observations
We obtained low resolution spectroscopic observations of XMMJ0510–67 using the 8.1 m Gemini South Telescope in Cerro Pachon, Chile, using GMOS in long slit mode. We obtained three exposures each lasting 1200 s on the night of 2017 March 26/27. We used the R400 grating plus G5325 filter with a slit of 1.5″ put in north-south direction which gave a resolution of R ~ 390–470 (blue to red). By the third exposure the seeing had degraded but the sequence was continued to allow the conclusion of the observations. The data were reduced using standard routines and we used the flux standard CD-32 9927 to remove the instrumental response. As shown in Fig. 1 there is a star which is slightly brighter than XMMJ0510–67 1.8″ to the East. Given the width of the slit and the poor seeing, there is a potential issue that the spectrum has been contaminated by the nearby star.
We extracted a spectrum from each observation and to increase the signal-to-noise ratio (S/N) we co-added the individual exposures resulting in an average spectrum with a S/N ≈ 10. There is no evidence of strong emission lines in the average spectrum. We find only evidence of a narrow feature at a wavelength consistent with Hα in absorption (see Fig. 4) and measure an equivalent width of 14 ± 2 Å of that line. However, we note that a HeII line at 6560 Å has been seen in some AM CVn systems (see for instance Green et al. 2018). A higher S/N spectrum is needed to search for the presence of Hβ and Hγ which would be expected if the line near 6563 Å is indeed hydrogen. Although the spectra are of low S/N, it is clear that there are no strong emission lines in the optical spectrum of XMMJ0510–67 and there is a possibility that hydrogen is present.
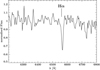 |
Fig. 4. Co-added optical spectrum of XMMJ0510–67 obtained using the Gemini South Telescope. Although the signal-to-noise was low we detected an absorption feature at a wavelength consistent with Hα. |
4. Discussion
We have found that the optical counterpart of XMMJ0510–67 shows a modulation on a period 23.6 min which is consistent with that detected in X-rays (Haberl et al. 2017). XMMJ0510– 67 therefore shows clear similarities with the two shortest known stellar binary systems HM Cnc and V407 Vul: all three show a periodic modulation at the same period in optical and X-ray wavelengths and all show a very soft X-ray spectrum. In HM Cnc and V407 Vul there is a phase offset between the X-ray and optical light curves. Because of the uncertainty in the X-ray period of XMMJ0510–67 we are unable to phase the X-ray and optical data on the same ephemeris.
As noted in Sect. 3 the optical spectrum of XMMJ0510– 67 shows no evidence for strong emission lines. This is very different to ES Cet with a period of 10.3 min which shows strong helium emission lines (Espaillat et al. 2005). However, CR Boo with a period of 24.5 min shows very weak absorption features in quiescence (Wood et al. 1987). HM Cnc has many weak helium emission lines, but with evidence for the presence of a small amount of hydrogen (Roelofs et al. 2010). The spectrum of V407 Vul appears similar to a G/K star spectrum and is highly likely to be due to a chance alignment with a background star (Steeghs et al. 2006). In Sect. 2 we noted that the optical colours for XMMJ0510–67 are g − r ~ 0.0 (Haberl et al. 2017) and u − g ~ 0.1–0.2 magnitudes. These apparent colours are significantly less blue than HM Cnc or ES Cet, or indeed most other AM CVn binaries. This maybe due to a significant degree of reddening in the direction of XMMJ0510–67: the Schlegel et al. (1998) dust maps give a mean extinction to the edge of the Galaxy of EB−V = 0.45. Even if the extinction to XMMJ0510–67 was half this amount the dereddended colours would be similar to the known AM CVn systems.
After their discovery there was much debate as to the nature of HM Cnc and V407 Vul. Models included a white dwarf-white dwarf strongly magnetic cataclysmic variable (Cropper et al. 1998); a white dwarf-red dwarf moderately magnetic cataclysmic variable (Norton et al. 2004); a unipolar inductor model in which electric currents heat up the more massive white dwarf so that X-rays are emitted (Wu et al. 2002); and a direct impact model where an accretion stream impacts directly onto the more massive white dwarf without forming a disc (Marsh et al. 2004). The mechanism for powering both sources remains an issue still to be resolved, although for HM Cnc the evidence seems to better support the direct impact model (Roelofs et al. 2010).
To make a further comparison with HM Cnc and V407 Vul we show in Fig. 5 the X-ray data in the 0.15–1 keV band of HM Cnc, V407 Vul and XMMJ0510–67 each folded on their X-ray periods (we extracted these data from the XMM-Newton archive1 and reduced the data in the same manner as Ramsay et al. (2005) and the most recent calibration files). As noted by previous authors, the X-ray pulse profiles of HM Cnc and V407 Vul are very similar, showing an on-off pulse where the off phase shows essentially zero X-ray flux. This is similar to that observed in XMMJ0510–67. However, in contrast, compared to HM Cnc and V407 Vul, the rise to maximum in XMMJ0510–67 is more gradual and the decline is more rapid – almost the reverse of HM Cnc and V407 Vul. This could be a clue to the location and extent of the emission region. For instance, Dolence et al. (2008) and Wood (2009) modelled the X-ray and optical phase folded light curves to place constraints on the extent of the X-ray generating spot assuming a direct impact model.
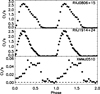 |
Fig. 5. XMM-Newton (0.15–1 keV) data of RX J0806+15 (top) folded on a period of 321 s; RX J1914+24 (middle) folded on a period of 569 s and XMMJ0510–67 (bottom) folded on a period of 1418 s. |
For a binary with an orbital period of 23.6 min, the mass accretor requires a relatively large radius and hence low mass in order for the accretion stream from the mass donor star to impact directly, although this is ameliorated by the reduction in binary separation for fixed period as the total system mass drops. To investigate this further we took the direct impact model of Marsh et al. (2004) to place constraints on the stellar masses. The left hand panel of Fig. 6 shows an example of a binary with masses (M1 = 0.35 M⊙, M2 = 0.14 M⊙) that can give rise to direct impact on the more massive white dwarf. The right hand panel shows the region of M1, M2 parameter space where, given some assumptions about the nature of the donor star to be explained below, stable direct impact accretion can occur. Not only must the system lie in this region now, it should have started mass transfer inside it; the direction of evolution assuming conservative mass transfer is indicated by an arrow in Fig. 6. Assuming that the donor must once have been at least 0.1 M⊙ leads to the sloping constraint on the left-hand side of the shaded regon. As expected, the accretor has to be of low mass (<0.5 M⊙) in order for direct impact accretion to take place.
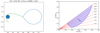 |
Fig. 6. Left-hand panel: an example of binary system with an orbital period of 23.6 min where direct impact accretion can occur: the parameters are M1 = 0.35 M⊙, M2 = 0.14 M⊙. The separation between the centre of the two stellar components is defined as unity. Right-hand panel: region of M1, M2 values that lead to direct impact. Below the curved part of the boundary, the accretor is too small for a direct impact to occur (Eq. (31) from Marsh et al. 2004). The diagonal sloping dashed lines mark the upper bound of stable accretion in the absence of tides for the different values of the logarithmic derivative of radius with respect to mass, ζ2 = d ln(R2)/d ln(M2). We arbitrarily take the case ζ2 = 1 to define the upper boundary which leads to q < 0.87. Models of helium star donors give lower values (ζ2 ≈ 0.2), while degenerate stars have ζ2 < 0, suggesting that the donor mass should lie in the lower half of the shaded region. The arrow shows the direction in which a given system would evolve in this diagram if undergoing conservative mass transfer. Along with the expectation that the donor must have started with mass >0.1 M⊙ this leads to the sloping boundary on the lower-left, although its exact location depends upon the assumed upper limit on ζ2. |
If the donor is completely degenerate, at a period of 23.6 min, it would have a mass of M2 = 0.026 M⊙, a value achieved right at the bottom tip of the shaded region with M1 ≈ 0.20 M⊙. Although a degenerate donor is thus just about possible, it seems likely that the donor has in fact significant entropy which would avoid the requirement that it started mass transfer at a mass as low as 0.1 M⊙. This is in any case consistent with the finding that much longer period AM CVn stars contain donor stars of significant entropy Green et al. (2018). The response of the donor star’s radius to the loss of mass is important for the stability of mass transfer. This is usually parameterised in terms of the logarithmic derivative of radius with respect to mass ζ2 given by
Degenerate stars expand upon loss of mass leading to ζ2 < 0 while non-degenerate stars have larger values of ζ2, which acts to stabilise mass transfer. In the case of direct impact accretion, loss of angular momentum from the orbit to the accretor is destabilising, while tides transferring the angular momentum from the accretor back to the orbit are stabilising (Marsh et al. 2004). In Fig. 6, dashed lines parameterised by ζ2 indicate the upper limit for stable accretion in the absence of tides (see Alexander 1973). Low mass helium stars may make suitable mass donors. Yungelson (2008) presents models of such stars in binaries which would fill their Roche lobe in a binary of period P = 23.6 min when M2 ≈ 0.06 M⊙ and R2 ≈ 0.05 R⊙, at which point ζ2 ≈ 0.2. Figure 6 shows that such a star could form the donor in a stable direct impact accretion system if the accretor’s mass lay in the range 0.15–0.30 M⊙. An alternative is that that both the donor and accretor started as extremely low mass (ELM) white dwarfs and the current system masses are M1 ≈ 0.2 M⊙ and M2 ≈ 0.03 M⊙. The donor in this case would be expected to have ζ2 close to the degenerate value, ≈−0.24, which would transfer mass stably according to Fig. 6. How the system is likely to evolve is a separate question and beyond the scope of this paper. It should also be remembered that tides could help stabilise systems that fail the stability limits of Fig. 6.
The above discussion hinges on the direct impact interpretation of the observational data. There are two important observational tests of the direct impact model for XMMJ0510–67. The first is the relative X-ray/optical phase. In the direct impact model, the optical phase is determined by the combination of light from the impact and from the possibly-irradiated donor, while the X-ray flux should be dominated by the impact region alone. We would always expect the optical flux to peak prior to the X-ray flux, as seen in HM Cnc and V407 Vul (Barros et al. 2007). However, comparing Fig. 6 with Fig. 1 of Marsh & Steeghs (2002), which examines the case for the shorter period systems, indicates that XMMJ0510–67’s longer period may make the phase difference relatively smaller than that seen in the shorter period systems. The second test is to measure the rate of period change which depends upon the component masses, ζ2 and the strength of any tides. For instance, the expected period derivative switches from positive to negative if ζ2 exceeds 1/3. Given the long period and faintness of XMMJ0510–67, this will be a challenging but significant constraint upon the nature of this interesting system. A third area of interest will be searching for a periodic modulation in the optical light curves at periods other than that of 23.6 min.
5. Conclusions
XMMJ0510–67 shows a periodic modulation in its X-ray flux on a period of 23.6 min. We find that the optical flux of XMMJ0510–67 is also modulated at a period consistent with the X-ray period. The most likely explanation is that this is an ultracompact binary with a period of 23.6 min. The X-ray folded light curve of XMMJ0510–67 shows similarities to that of HM Cnc and V407 Vul although in XMMJ0510–67 the profile seems to be reversed (i.e. there is a sharp decline towards minimum flux rather than from minimum). XMMJ0510–67 and HM Cnc and V407 Vul all show a very soft X-ray spectrum. Using only an assumption that 23.6 min is the orbital period, we find that the direct impact accretor model can produce stable accretion for a range of binary mass combinations. Low mass helium stars or extremely low mass white dwarfs may be able to match the properties needed of the donor in this system, but evolutionary modelling is required to see if binaries of the right component masses can be produced. The next goal observationally is to obtain contemporaneous X-ray and optical data to allow a reliable phasing of the multi-wavelength data to determine if they are offset as predicted by the direct impact model. Given the faintness of the object it will be a challenge to obtain phase-resolved optical spectroscopy to identify radial velocity variations on a timescale of 23.6 min.
Acknowledgments
This paper is based on observations collected at the European Organisation for Astronomical Research in the Southern Hemisphere under ESO programme 0102.D-0151. We thank Steven Parsons and Jay Farihi for carrying out the observations. Some results presented in this paper are based on observations obtained at the Gemini Observatory, proposal ID GS-2016B-FT-25, which is operated by the Association of Universities for Research in Astronomy, Inc., under a cooperative agreement with the NSF on behalf of the Gemini partnership: the National Science Foundation (United States), the National Research Council (Canada), CONICYT (Chile), Ministerio de Ciencia, Tecnología e Innovación Productiva (Argentina), and Ministério da Ciência, Tecnologia e Inovação (Brazil). The authors thank the staff at the Gemini-South observatory for performing the observations in service mode. Armagh Observatory and Planetarium is core funded by the Northern Ireland Executive through the Department for Communities. TRM and DS thank STFC for support via grants ST/L000733/1 and ST/P000495/1. VSD and ULTRACAM thank STFC for support via consolidated grant ST/J001589.
References
- Alexander, M. E. 1973 Ap&SS, 23, 459 [NASA ADS] [CrossRef] [Google Scholar]
- Barros, S. C. C., Marsh, T.R., Dhillon, V. S., et al. 2007, MNRAS, 374, 1334 [NASA ADS] [CrossRef] [Google Scholar]
- Bertin, E. 2011, Astronomical Data Analysis Software and Systems XX, ed. I. N. Evans, ASP Conf. Ser., 442, 435 [NASA ADS] [Google Scholar]
- Cropper, M., Harrop-Allin, M. K., Mason, K. O., et al. 1998, MNRAS, 293, L57 [NASA ADS] [CrossRef] [Google Scholar]
- Dhillon, V. S., Marsh, T. R., Stevenson, M. J., et al. 2007, MNRAS, 378, 825 [NASA ADS] [CrossRef] [MathSciNet] [Google Scholar]
- Dolence, J., Wood, M. A., Silver, I. 2008, ApJ, 683, 375 [NASA ADS] [CrossRef] [Google Scholar]
- Eaton, N., Draper, P. W., & Allan, A. 2009,User Note, 45 [Google Scholar]
- Espaillat, C., Patterson, J., Warner, B., et al. PASP, 2005, 117, 189 [NASA ADS] [CrossRef] [Google Scholar]
- Green, M., Marsh, T. R., Steeghs, D., et al. 2018, MNRAS, 476, 1663 [NASA ADS] [CrossRef] [Google Scholar]
- Haberl, F., Israel, G. L., Rodriguez Castillo, G. A., et al. 2017, A&A, 598, A69 [NASA ADS] [CrossRef] [EDP Sciences] [Google Scholar]
- Israel, G. L., Panzera, M. R., Campana, S., et al. 1999, A&A, 349, L1 [NASA ADS] [Google Scholar]
- Israel, G. L., Hummel, W., Covino, S., et al. 2002, A&A, 386, L13 [NASA ADS] [CrossRef] [EDP Sciences] [Google Scholar]
- Kilic, M., et al. 2014, MNRAS, 438, L26 [NASA ADS] [CrossRef] [Google Scholar]
- Korol, V., Rossi, E. M., Groot, P. J., et al. 2017, MNRAS, 470, 1894 [NASA ADS] [CrossRef] [Google Scholar]
- Marsh, T. R., & Steeghs, D. 2002, MNRAS, 311, L7 [NASA ADS] [CrossRef] [Google Scholar]
- Marsh, T. R., Nelemans, G., & Steeghs, D. 2004, MNRAS, 350, 113 [NASA ADS] [CrossRef] [Google Scholar]
- Motch, C., Haberl, F., & Guillout, P. 1996, A&A, 307, 459 [NASA ADS] [Google Scholar]
- Nelemans, G. 2013, The 9th LISA Symp., ASP Conf. Ser., 467, 27 [Google Scholar]
- Norton, A. J., Haswell, C. A., & Wynn, G. A. 2004, A&A, 419, 1025 [NASA ADS] [CrossRef] [EDP Sciences] [Google Scholar]
- Ramsay, G., Cropper, M., Wu, K., et al. 2000, MNRAS, 311, 75 [NASA ADS] [CrossRef] [Google Scholar]
- Ramsay, G., Hakala, P., & Cropper, M. 2002, MNRAS, 332, L7 [NASA ADS] [CrossRef] [Google Scholar]
- Ramsay, G., Hakala, P., Wu, K., et al. 2005, MNRAS, 357, 49 [NASA ADS] [CrossRef] [Google Scholar]
- Roelofs, G. H. A., Rau, A., Marsh, T. R., et al. 2010, ApJ, 711, L138 [NASA ADS] [CrossRef] [Google Scholar]
- Scalzo, R. A., et al. 2017, PASA, 34, 30 [Google Scholar]
- Schlegel, D. J., Finkbeiner, D. P., & Davis, M. 1998, ApJ, 500, 525 [NASA ADS] [CrossRef] [Google Scholar]
- Solheim, J.-E. 2010, PASP, 122, 1133 [NASA ADS] [CrossRef] [Google Scholar]
- Steeghs, D., Marsh, T. R., Barros, S. C. C., et al. 2006, ApJ, 649, 382 [NASA ADS] [CrossRef] [Google Scholar]
- Warner, B., & Woudt, P. A. 2002, PASP, 114, 129 [NASA ADS] [CrossRef] [Google Scholar]
- Wood, M. A. 2009, MNRAS, 395, 378 [NASA ADS] [CrossRef] [Google Scholar]
- Wood, M. A., Winget, D. E., Nather, R. E., et al. 1987, ApJ, 313, 757 [NASA ADS] [CrossRef] [Google Scholar]
- Wu, K., Cropper, M., Ramsay, G., et al. 2002, MNRAS, 331, 221 [NASA ADS] [CrossRef] [Google Scholar]
- Yungelson, L. 2008, Astron. Lett., 34, 620 [NASA ADS] [CrossRef] [Google Scholar]
All Tables
Period and amplitude of the modulation in the detrended u′g′r′ light curves of XMMJ0510–67.
All Figures
|
Fig. 1. Co-added g′ band image of the field surrounding XMMJ0510– 67 (which is marked by two arrows and is source “1” in Fig 9 of Haberl et al. 2017). It was made from all 727 g′ band images each with an exposure of 20 s. The image is 1 × 1 arcmin across with North being to the top and East to the left. We estimate the depth of the image reaches g′ ~ 23.6. |
| In the text | |
|
Fig. 2. Left-hand panels: light curve of XMMJ0510–67 made using the NTT and ULTRACAM in the r′ band (upper), g′ band (middle) and u′ band (lower) and normalised so the mean magnitude is 0.0. Right-hand panels: Lomb-Scargle periodogram of the light curves shown in the left hand panels. |
| In the text | |
|
Fig. 3. Light curves of XMMJ0510–67 in the u′g′r′ filters folded on a period of 23.63 min and To = HMJD 58079.112. |
| In the text | |
|
Fig. 4. Co-added optical spectrum of XMMJ0510–67 obtained using the Gemini South Telescope. Although the signal-to-noise was low we detected an absorption feature at a wavelength consistent with Hα. |
| In the text | |
|
Fig. 5. XMM-Newton (0.15–1 keV) data of RX J0806+15 (top) folded on a period of 321 s; RX J1914+24 (middle) folded on a period of 569 s and XMMJ0510–67 (bottom) folded on a period of 1418 s. |
| In the text | |
|
Fig. 6. Left-hand panel: an example of binary system with an orbital period of 23.6 min where direct impact accretion can occur: the parameters are M1 = 0.35 M⊙, M2 = 0.14 M⊙. The separation between the centre of the two stellar components is defined as unity. Right-hand panel: region of M1, M2 values that lead to direct impact. Below the curved part of the boundary, the accretor is too small for a direct impact to occur (Eq. (31) from Marsh et al. 2004). The diagonal sloping dashed lines mark the upper bound of stable accretion in the absence of tides for the different values of the logarithmic derivative of radius with respect to mass, ζ2 = d ln(R2)/d ln(M2). We arbitrarily take the case ζ2 = 1 to define the upper boundary which leads to q < 0.87. Models of helium star donors give lower values (ζ2 ≈ 0.2), while degenerate stars have ζ2 < 0, suggesting that the donor mass should lie in the lower half of the shaded region. The arrow shows the direction in which a given system would evolve in this diagram if undergoing conservative mass transfer. Along with the expectation that the donor must have started with mass >0.1 M⊙ this leads to the sloping boundary on the lower-left, although its exact location depends upon the assumed upper limit on ζ2. |
| In the text | |
Current usage metrics show cumulative count of Article Views (full-text article views including HTML views, PDF and ePub downloads, according to the available data) and Abstracts Views on Vision4Press platform.
Data correspond to usage on the plateform after 2015. The current usage metrics is available 48-96 hours after online publication and is updated daily on week days.
Initial download of the metrics may take a while.