Fig. A.1.
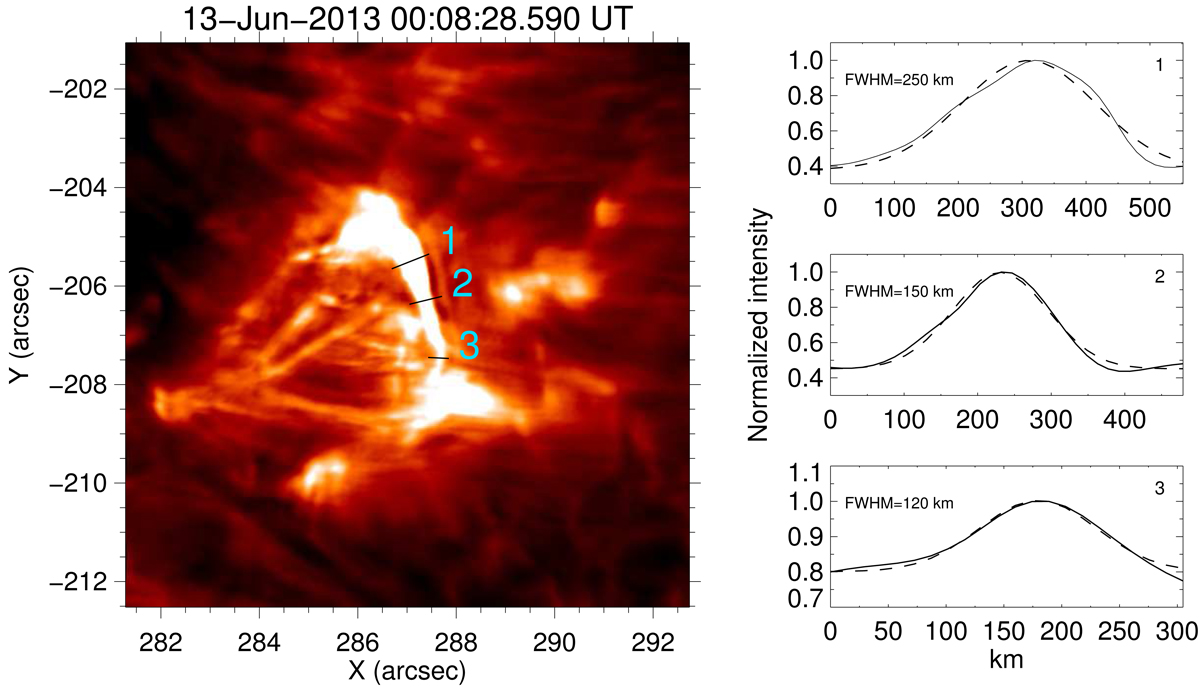
Extended ribbon-like feature associated with the burst. The left panel covers the full extent of the burst and is at the same time-step as the left panel in Fig. 4. Three sample ribbon segments are marked by black lines, numbered 1–3. The intensity profiles (solid) and their Gaussian fits (dashed) along the three ribbon segments are shown in the right panels. The FWHMs of the three ribbon segments are quoted in the respective panels. See Sect. 5 for details.
Current usage metrics show cumulative count of Article Views (full-text article views including HTML views, PDF and ePub downloads, according to the available data) and Abstracts Views on Vision4Press platform.
Data correspond to usage on the plateform after 2015. The current usage metrics is available 48-96 hours after online publication and is updated daily on week days.
Initial download of the metrics may take a while.