Fig. 5
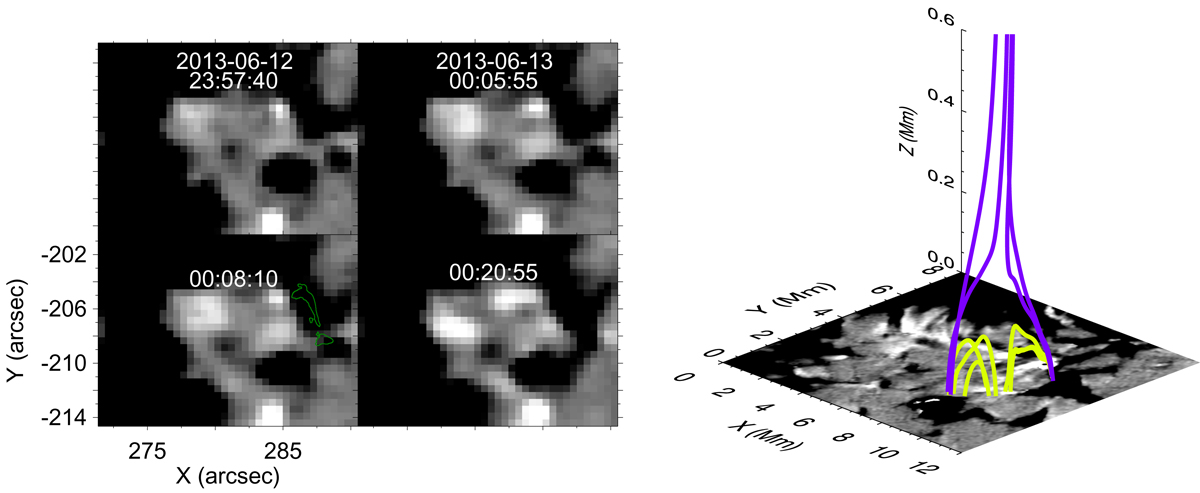
Distribution of the surface magnetic field underlying the burst. Left: sequence of HMI line-of-sight magnetic field maps, nearly simultaneous with the SuFI images in Fig. 2, saturated at ±100 G. The FOV here is marked by the solid white box in the IMaX map in Fig. 1. The contour is the same as the outer contour in Fig. 2 that outlines the ribbon-like feature observed in SuFI. Right: grayscale image is a sub-FOV of the IMaX LOS magnetic field (boxed region from Fig. 1). Selected magnetic field extrapolations are plotted in blue (open/spine) and yellow (closed/dome) to show the magnetic topology surrounding the burst. See Sect. 6 for details.
Current usage metrics show cumulative count of Article Views (full-text article views including HTML views, PDF and ePub downloads, according to the available data) and Abstracts Views on Vision4Press platform.
Data correspond to usage on the plateform after 2015. The current usage metrics is available 48-96 hours after online publication and is updated daily on week days.
Initial download of the metrics may take a while.