Fig. 4
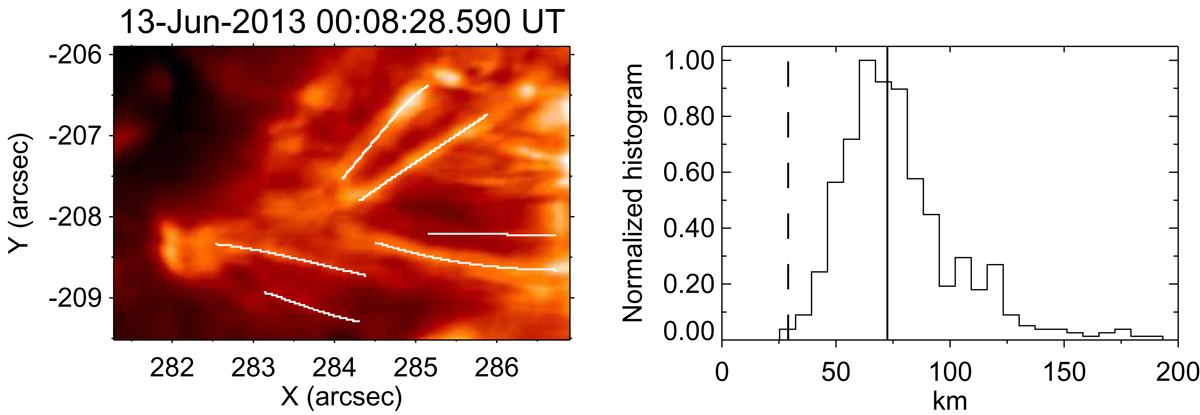
Magnetic loop-like features associated with the burst studied here. Left: sub-FOV of the SuFI map from Fig. 2 showing the loops. A few of the traced structures are highlighted with solid lines. Right: distribution of widths of selected loops along their length. The distribution shows the full width at half maximum of Gaussian fits to the intensity profile across a given loop at each position along the loop. The dashed and solid vertical lines respectively denote twice the pixel scale and diffraction limited spatial resolution of SuFI at 3968 Å. See Sect. 5 for details.
Current usage metrics show cumulative count of Article Views (full-text article views including HTML views, PDF and ePub downloads, according to the available data) and Abstracts Views on Vision4Press platform.
Data correspond to usage on the plateform after 2015. The current usage metrics is available 48-96 hours after online publication and is updated daily on week days.
Initial download of the metrics may take a while.