Fig. 2
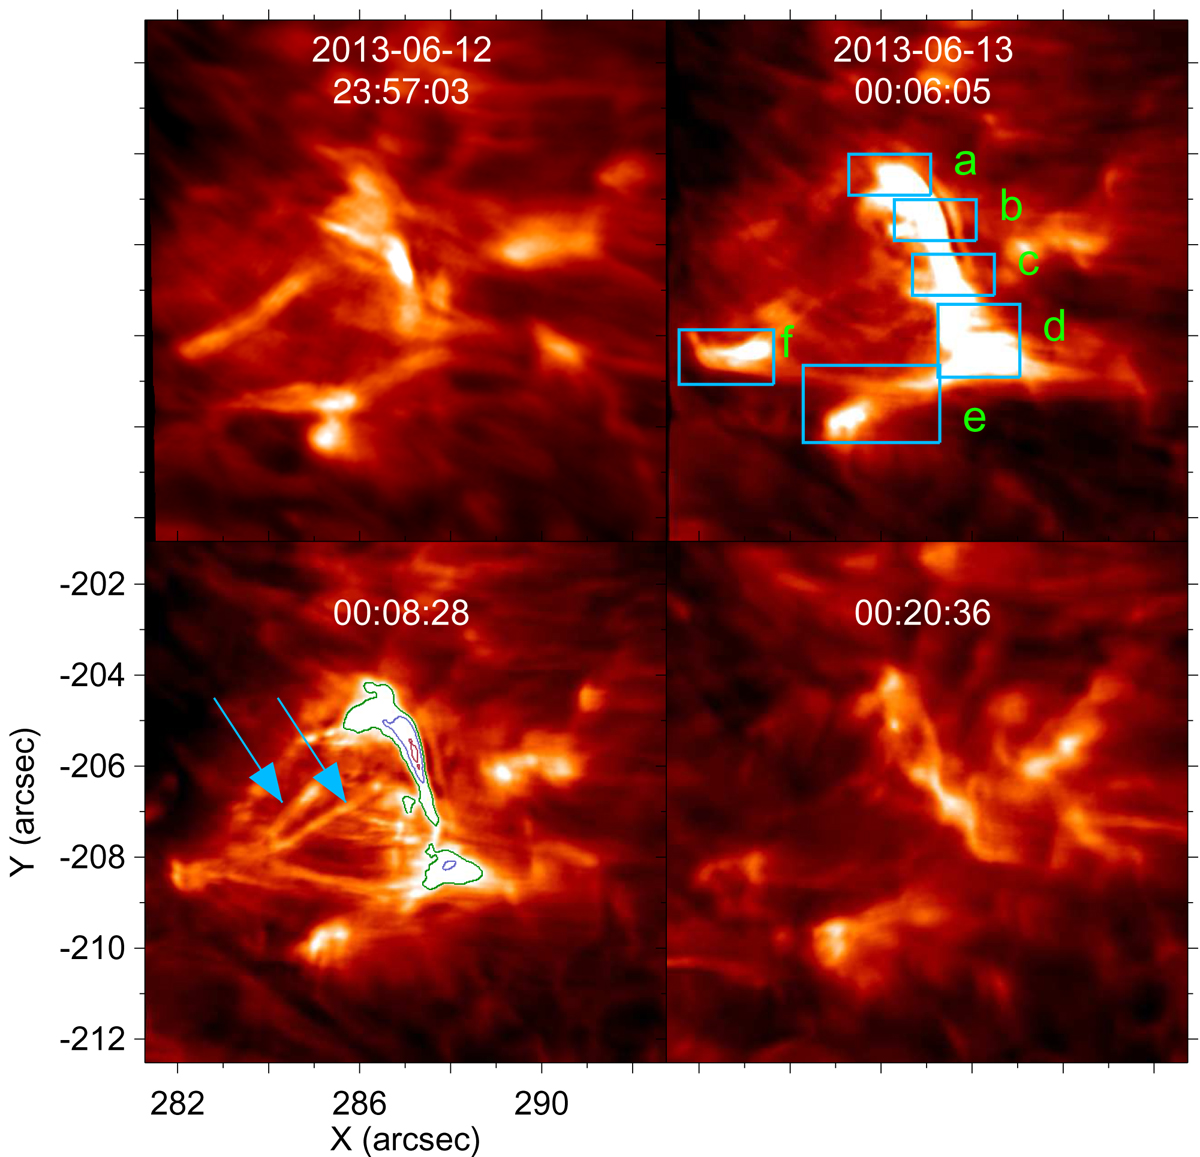
Spatial and temporal evolution of the chromospheric burst. The top left and bottom right panels mark the beginning and end of the heating event. The other two panels show intermediate stages. Boxes a–f are used to compute the average intensities plotted in Fig. 3. The outer to inner contours enclose the regions with intensities of (0.5, 0.7, 0.9) × Imax in the ribbon-like feature. Here, Imax is the intensity maximum in the respective SuFI snapshot. The arrows point to loop-like features associated with the burst. See Sect. 3 for details. The entire time series of this event is available as an online movie.
Current usage metrics show cumulative count of Article Views (full-text article views including HTML views, PDF and ePub downloads, according to the available data) and Abstracts Views on Vision4Press platform.
Data correspond to usage on the plateform after 2015. The current usage metrics is available 48-96 hours after online publication and is updated daily on week days.
Initial download of the metrics may take a while.