Fig. 1
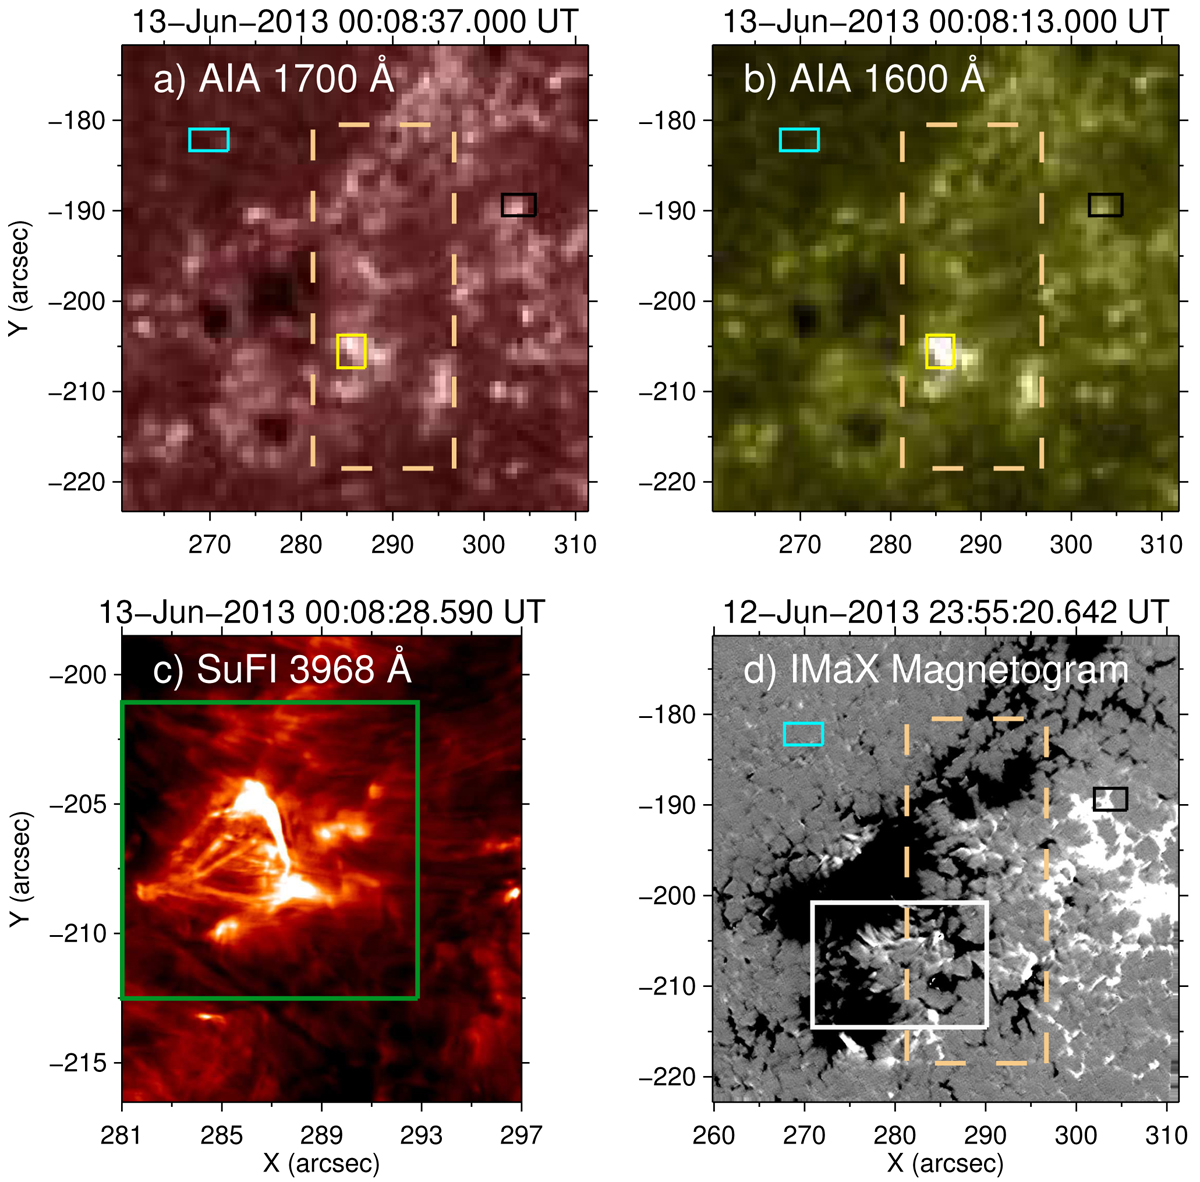
Overview of the chromospheric burst. Panel a: AIA 1700 Å map showing the upper photosphere, Panel b: AIA 1600 Å displaying the upper photosphere and traces of transition region plasma at ∼105 K due to the contribution from the C IV doublet at 1550 Å. The solid yellow boxes at (286″, −206″) in panels a and b mark the location of the burst. Panel c: SuFI narrowband filter image of Ca II H at 3968 Å showing the burst at a factor of 10 higher spatial resolution. A bright ribbon-like feature and several narrow fibrilar features can be seen. Based on the results of the magnetic field extrapolation, we see that these fibrils are associated with small magnetic loops. Therefore, we call them loop-like structures. The box marks the region displayed in Fig. 2. Panel d: distribution of the line-of-sight component of the magnetic field underlying the burst, obtained by the IMaX and saturated at ±250 G. The box highlights the region displayed in Fig. 5. The solid cyan boxes in panels a, b, and d at (273″, −182″) cover a quiet Sun region, and the solid black boxes in these panels at (303″, −190″) cover a magnetic concentration, both outside the SuFI FOV. This map is the last of the available IMaX observations and this it is not co-temporal with the other maps. The full FOV of SuFI is indicated by a dashed box in panels a, b, and d. Only a part of the SuFI FOV is plotted in panel c. See Sects. 2 and 3 for details.
Current usage metrics show cumulative count of Article Views (full-text article views including HTML views, PDF and ePub downloads, according to the available data) and Abstracts Views on Vision4Press platform.
Data correspond to usage on the plateform after 2015. The current usage metrics is available 48-96 hours after online publication and is updated daily on week days.
Initial download of the metrics may take a while.