Fig. 8.
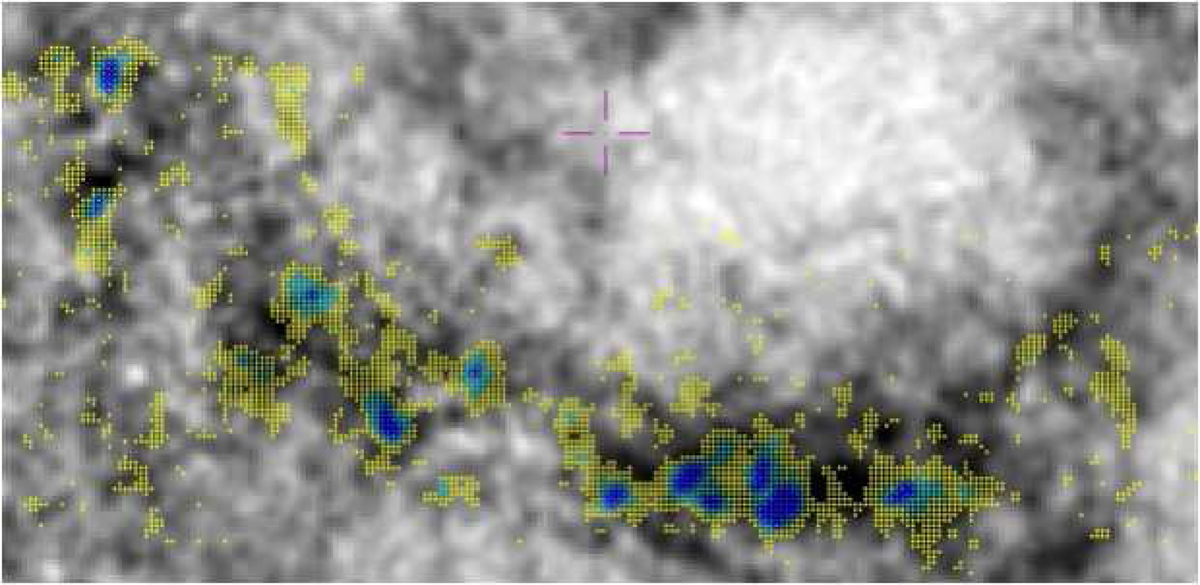
Image of the southern arm with the HI map in the background and colors underlining the CO core-envelope cloud structure that follow a power-law PDF. For the CO emission we plot in yellow all pixels with molecular surface densities 1021 < NH < 2.5 × 1021 cm−2, in cyan all pixels that have 2.5 × 10²¹ < NH < 4 × 1021 cm−2, and finally, we show in blue the core of GMCs with NH > 4 × 1021 cm−2.
Current usage metrics show cumulative count of Article Views (full-text article views including HTML views, PDF and ePub downloads, according to the available data) and Abstracts Views on Vision4Press platform.
Data correspond to usage on the plateform after 2015. The current usage metrics is available 48-96 hours after online publication and is updated daily on week days.
Initial download of the metrics may take a while.