Fig. 3.
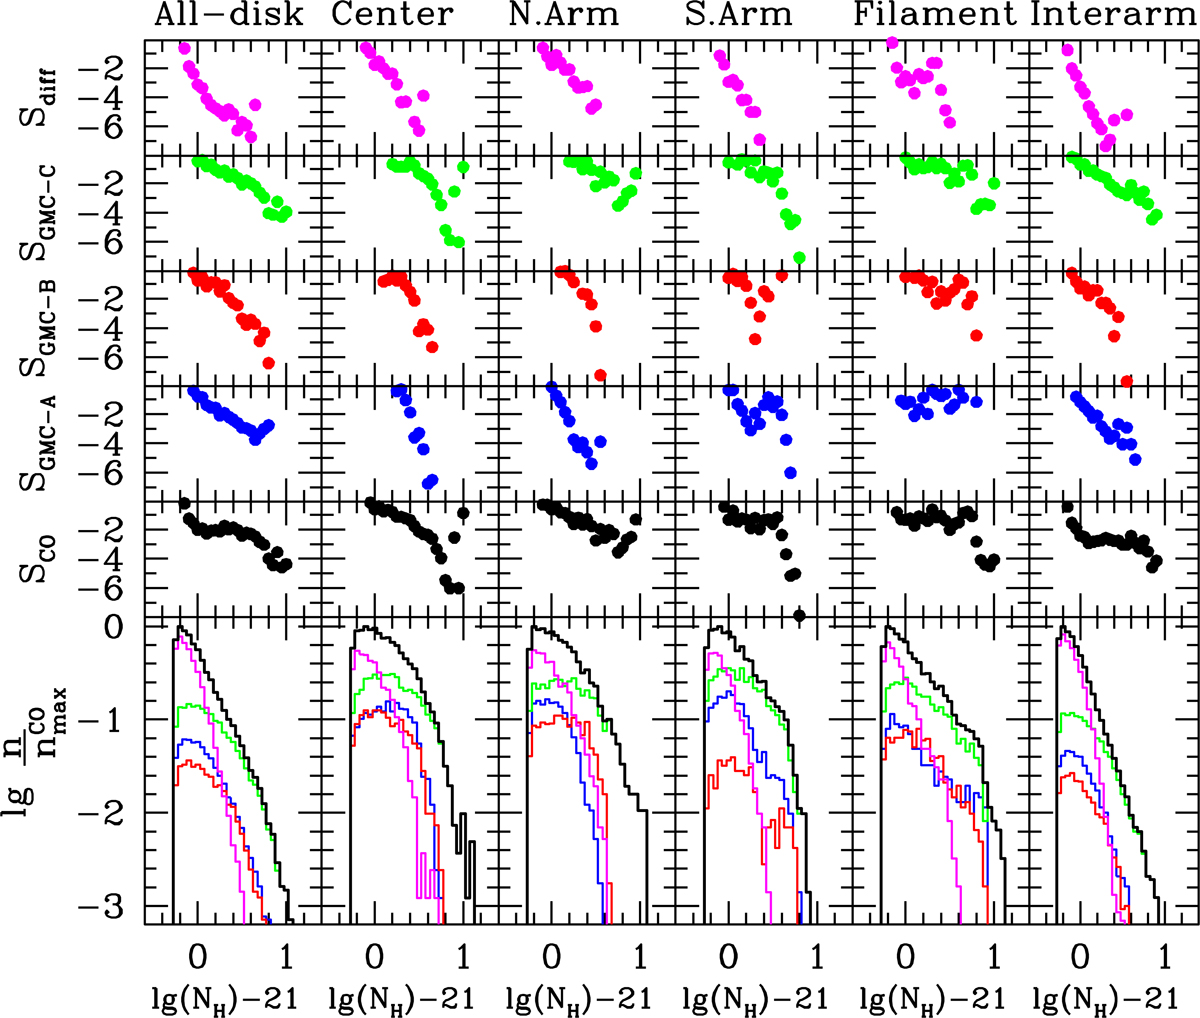
Bottom panels: PDFs of the molecular gas column density in units of H atoms cm−2 for the total molecular gas in the disk (black heavy curves), and for the gas in three GMC types: A (non-star forming), B (embedded star formation), and C (exposed star formation) in blue, red, and green, respectively. The PDF for diffuse molecular gas (meaning low-mass clouds or truly diffuse) is marked in magenta. All PDFs have been normalized to the number of pixels at the peak of the total molecular gas distribution ![]() and refer to face-on values. Top panels: the local slopes S in the corresponding PDFs for the total molecular gas surface density, SCO, for the molecular gas surface density of type A-, B-, and C-GMCs, and for the diffuse molecular gas. The columns correspond to different regions in the galaxy: the full disk is on the left, followed by the central region, the northern and southern spiral arms, and the eastern filament. The combination of molecular gas from the rest of the galaxy is labeled “interarm” and is shown on the right.
and refer to face-on values. Top panels: the local slopes S in the corresponding PDFs for the total molecular gas surface density, SCO, for the molecular gas surface density of type A-, B-, and C-GMCs, and for the diffuse molecular gas. The columns correspond to different regions in the galaxy: the full disk is on the left, followed by the central region, the northern and southern spiral arms, and the eastern filament. The combination of molecular gas from the rest of the galaxy is labeled “interarm” and is shown on the right.
Current usage metrics show cumulative count of Article Views (full-text article views including HTML views, PDF and ePub downloads, according to the available data) and Abstracts Views on Vision4Press platform.
Data correspond to usage on the plateform after 2015. The current usage metrics is available 48-96 hours after online publication and is updated daily on week days.
Initial download of the metrics may take a while.