Fig. 1.
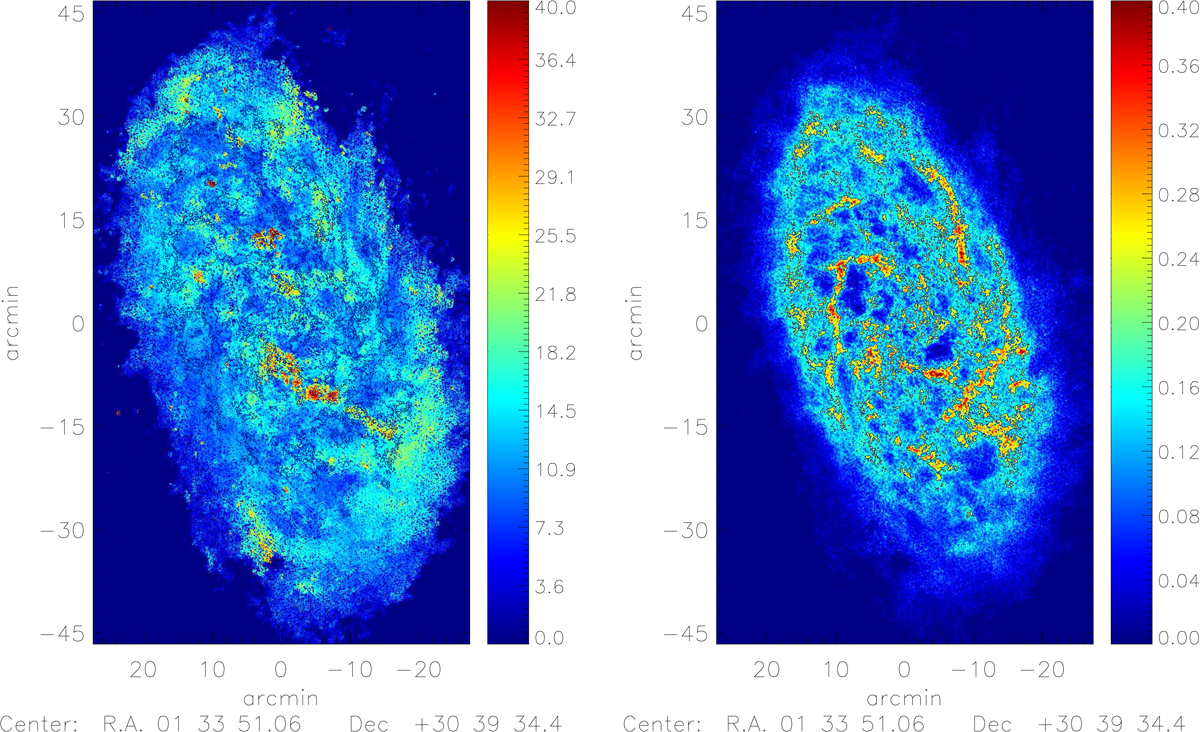
Velocity dispersion (moment-2) map of the 21 cm line emission in M 33 at 10 arcsec resolution (left panel). The black contours underline the location of the bright HI filaments or arms, they are drawn at 0.2 Jy beam−1 km s−1 and overlaid also on the moment-0 map in the right panel. The two areas that have been masked out for the likely presence of gas infall/outflow (the stream toward the central region in the southern half and a smaller region above the northern arm) have anomalously large velocity dispersions and have yellow-red colors in the velocity dispersion map. The color legend for the velocity dispersion map (left panel) is in units of km s−1, and for the intensity map (right panel), it is in Jy beam−1 km s−1. Maps are centered on RA = 23.4620417 and Dec = 30.6602222, (M33 coordinates).
Current usage metrics show cumulative count of Article Views (full-text article views including HTML views, PDF and ePub downloads, according to the available data) and Abstracts Views on Vision4Press platform.
Data correspond to usage on the plateform after 2015. The current usage metrics is available 48-96 hours after online publication and is updated daily on week days.
Initial download of the metrics may take a while.