Fig. 6.
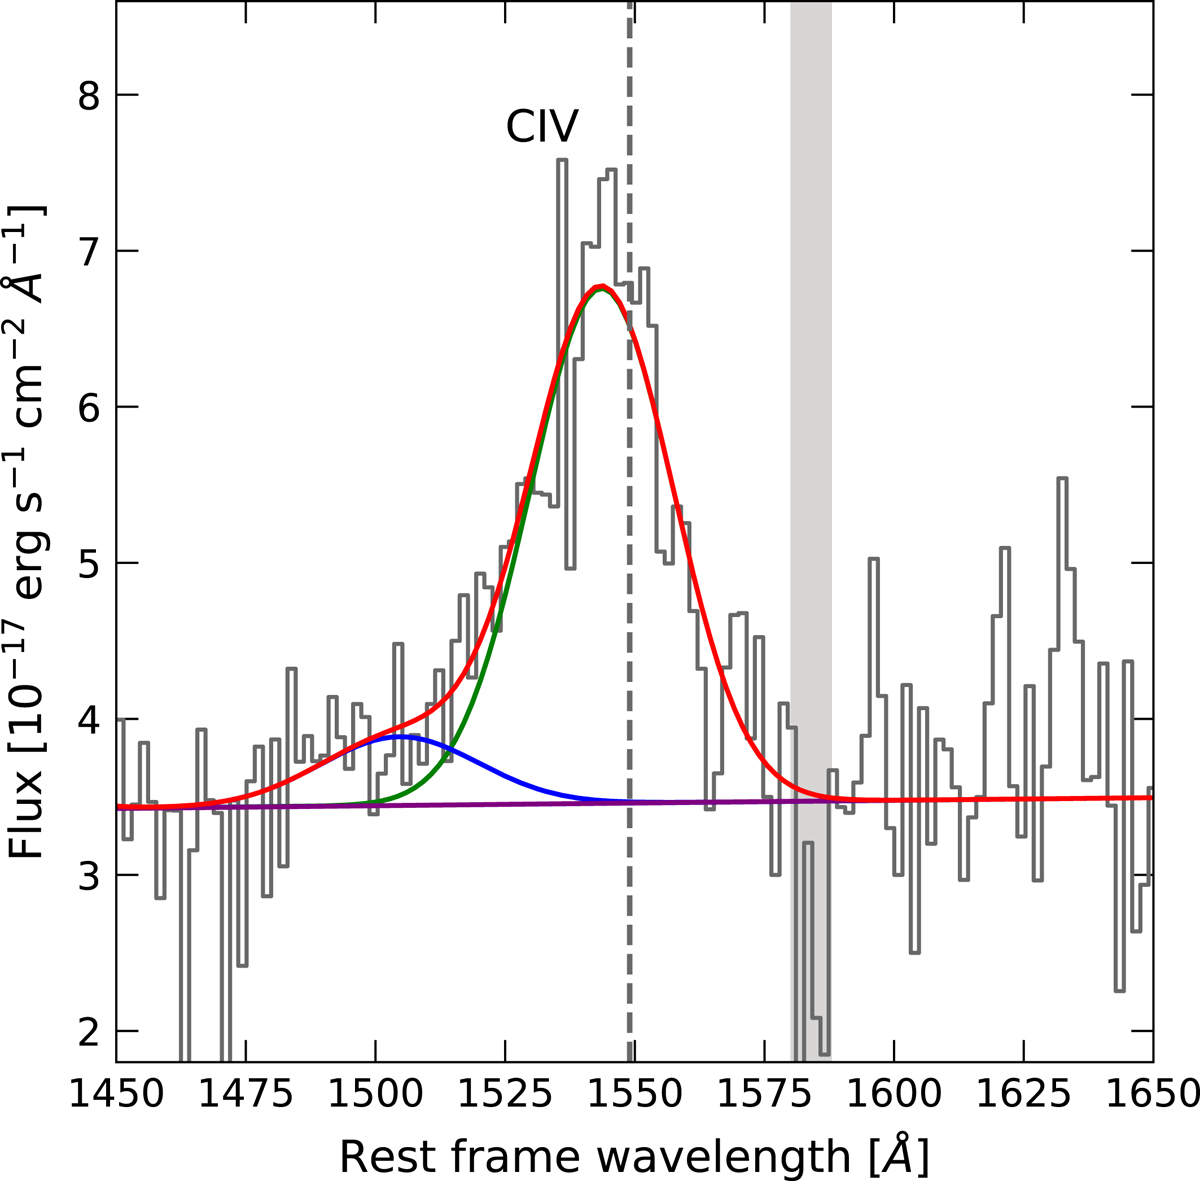
Rest-frame UV spectrum of J1015+0020, corresponding to the CIV spectral region. The total best fit model is shown in red, while the green(blue) curve refers to the CIV core(wing) emission. Continuum emission is shown in purple. The vertical dashed line corresponds to the z[CII] of the QSO and the grey shaded region indicates the spectral region excluded from the fit because of telluric features.
Current usage metrics show cumulative count of Article Views (full-text article views including HTML views, PDF and ePub downloads, according to the available data) and Abstracts Views on Vision4Press platform.
Data correspond to usage on the plateform after 2015. The current usage metrics is available 48-96 hours after online publication and is updated daily on week days.
Initial download of the metrics may take a while.