Fig. 4.
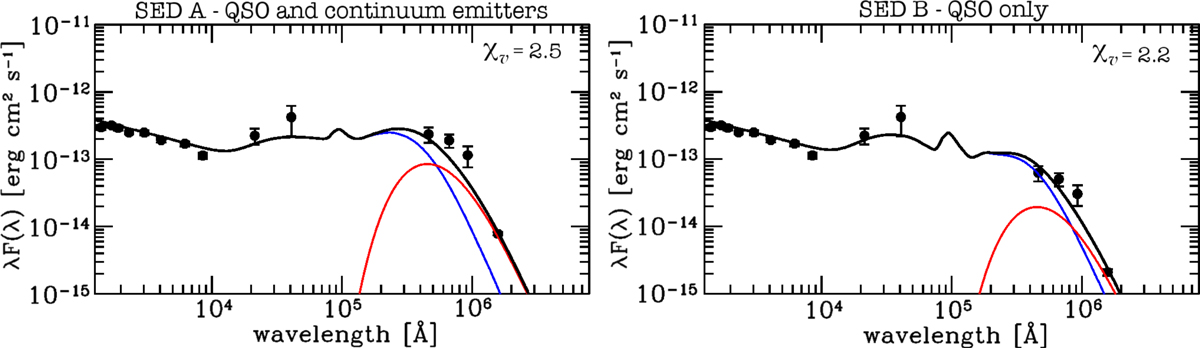
Rest-frame SED of J1015+0020 before (left panel) and after (right panel) removing the contamination to the FIR fluxes of the continuum emitters in the ALMA FOV. Black circles indicate the rest-frame photometric points. The black curve represents the total best fit model, while blue and red curves refer to the accretion disk plus torus and cold dust emission, respectively.
Current usage metrics show cumulative count of Article Views (full-text article views including HTML views, PDF and ePub downloads, according to the available data) and Abstracts Views on Vision4Press platform.
Data correspond to usage on the plateform after 2015. The current usage metrics is available 48-96 hours after online publication and is updated daily on week days.
Initial download of the metrics may take a while.