Fig. 3.
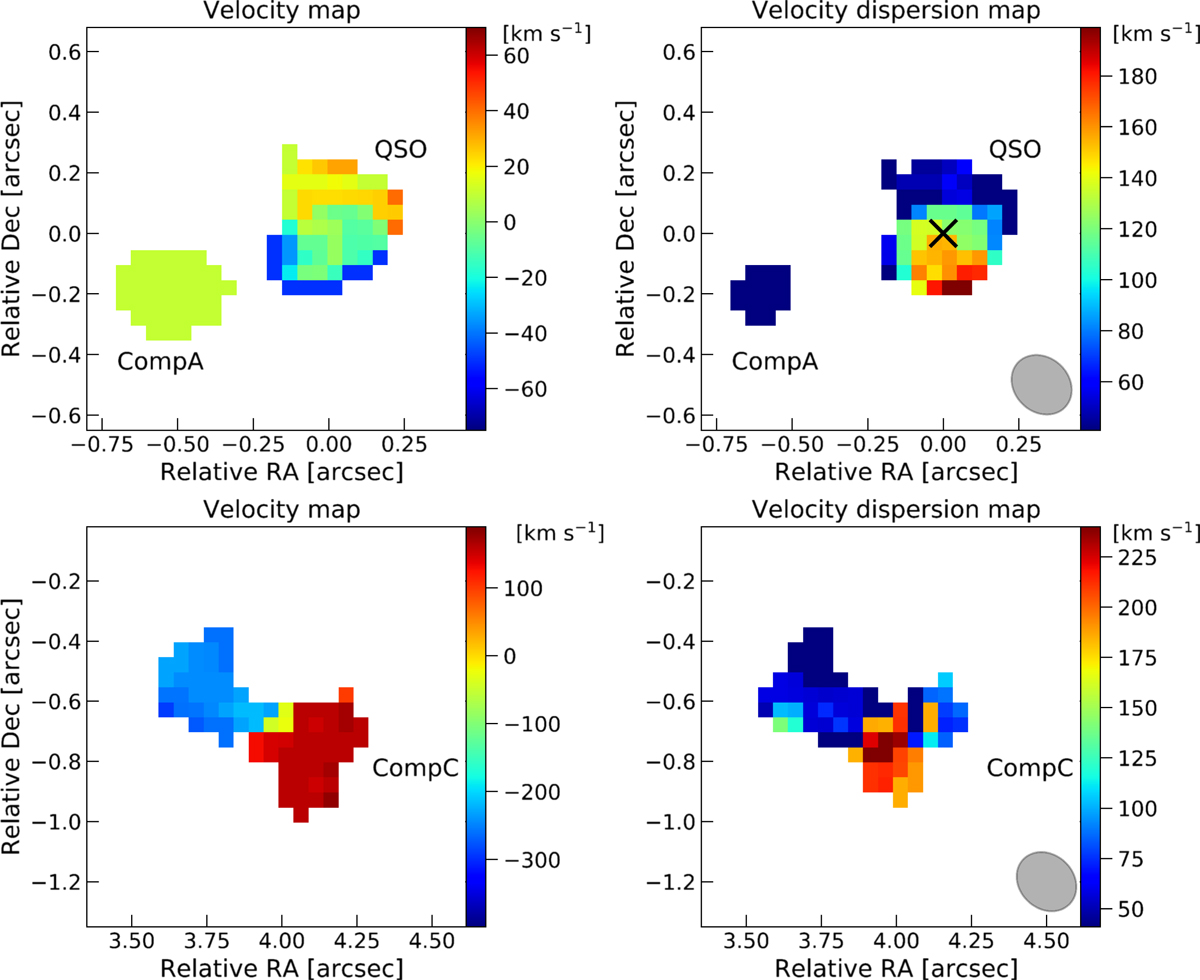
Velocity and velocity dispersion maps of J1015+0020 (top panel) and CompC (bottom panel), corresponding to the emitting regions with a signal-to-noise ratio higher than 3 for J1015+0020 and higher than 2.5 for CompC. Colour bars indicate the velocity and velocity dispersion range of the maps. The ALMA beam is also shown in the right panels as a grey ellipse.
Current usage metrics show cumulative count of Article Views (full-text article views including HTML views, PDF and ePub downloads, according to the available data) and Abstracts Views on Vision4Press platform.
Data correspond to usage on the plateform after 2015. The current usage metrics is available 48-96 hours after online publication and is updated daily on week days.
Initial download of the metrics may take a while.