Fig. 2.
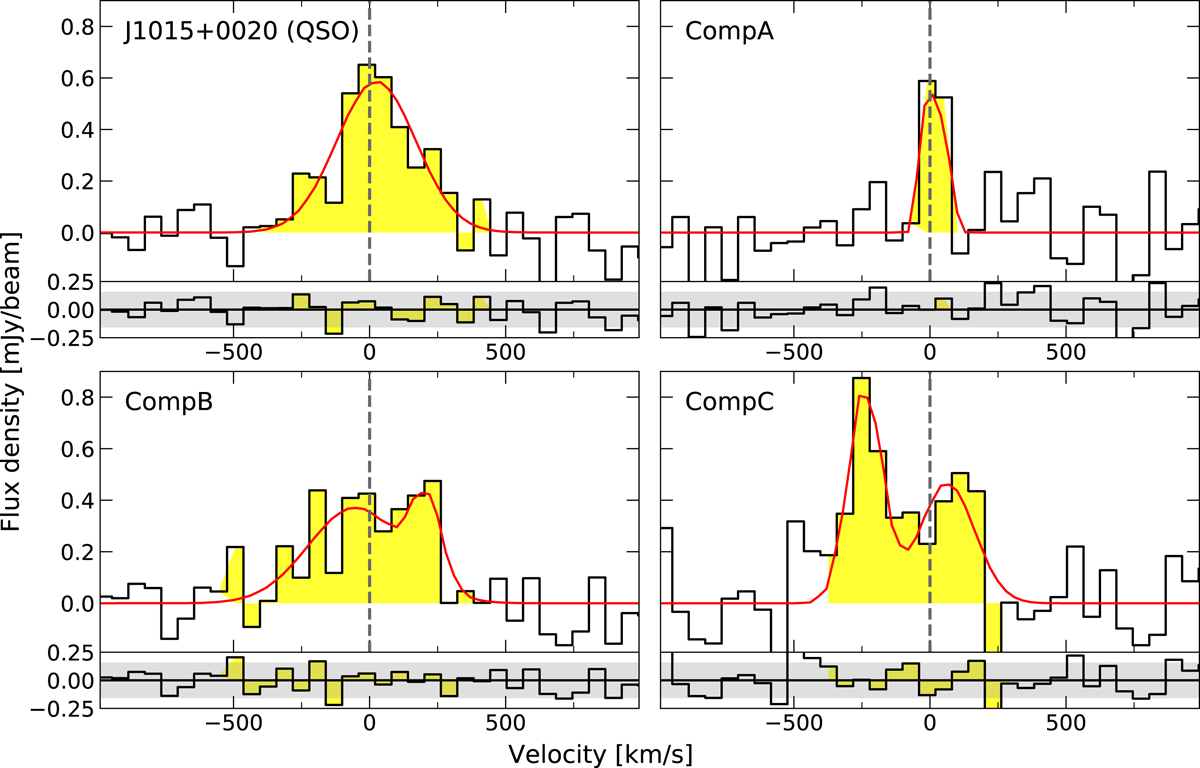
ALMA continuum-subtracted spectra of the [CII] emission line of J1015+0020 and its companion [CII] emitters, extracted from an area of 1.5 to 2 beam areas, according to the source. The continuum-subtracted [CII] flux density is shown as a function of the relative velocity with respect to the QSO redshift z[CII], indicated by the dashed vertical line. The plotted channel width corresponds to 60 km s−1. The red curve represents the best fit to the data of one or two Gaussians model.
Current usage metrics show cumulative count of Article Views (full-text article views including HTML views, PDF and ePub downloads, according to the available data) and Abstracts Views on Vision4Press platform.
Data correspond to usage on the plateform after 2015. The current usage metrics is available 48-96 hours after online publication and is updated daily on week days.
Initial download of the metrics may take a while.