Fig. 1.
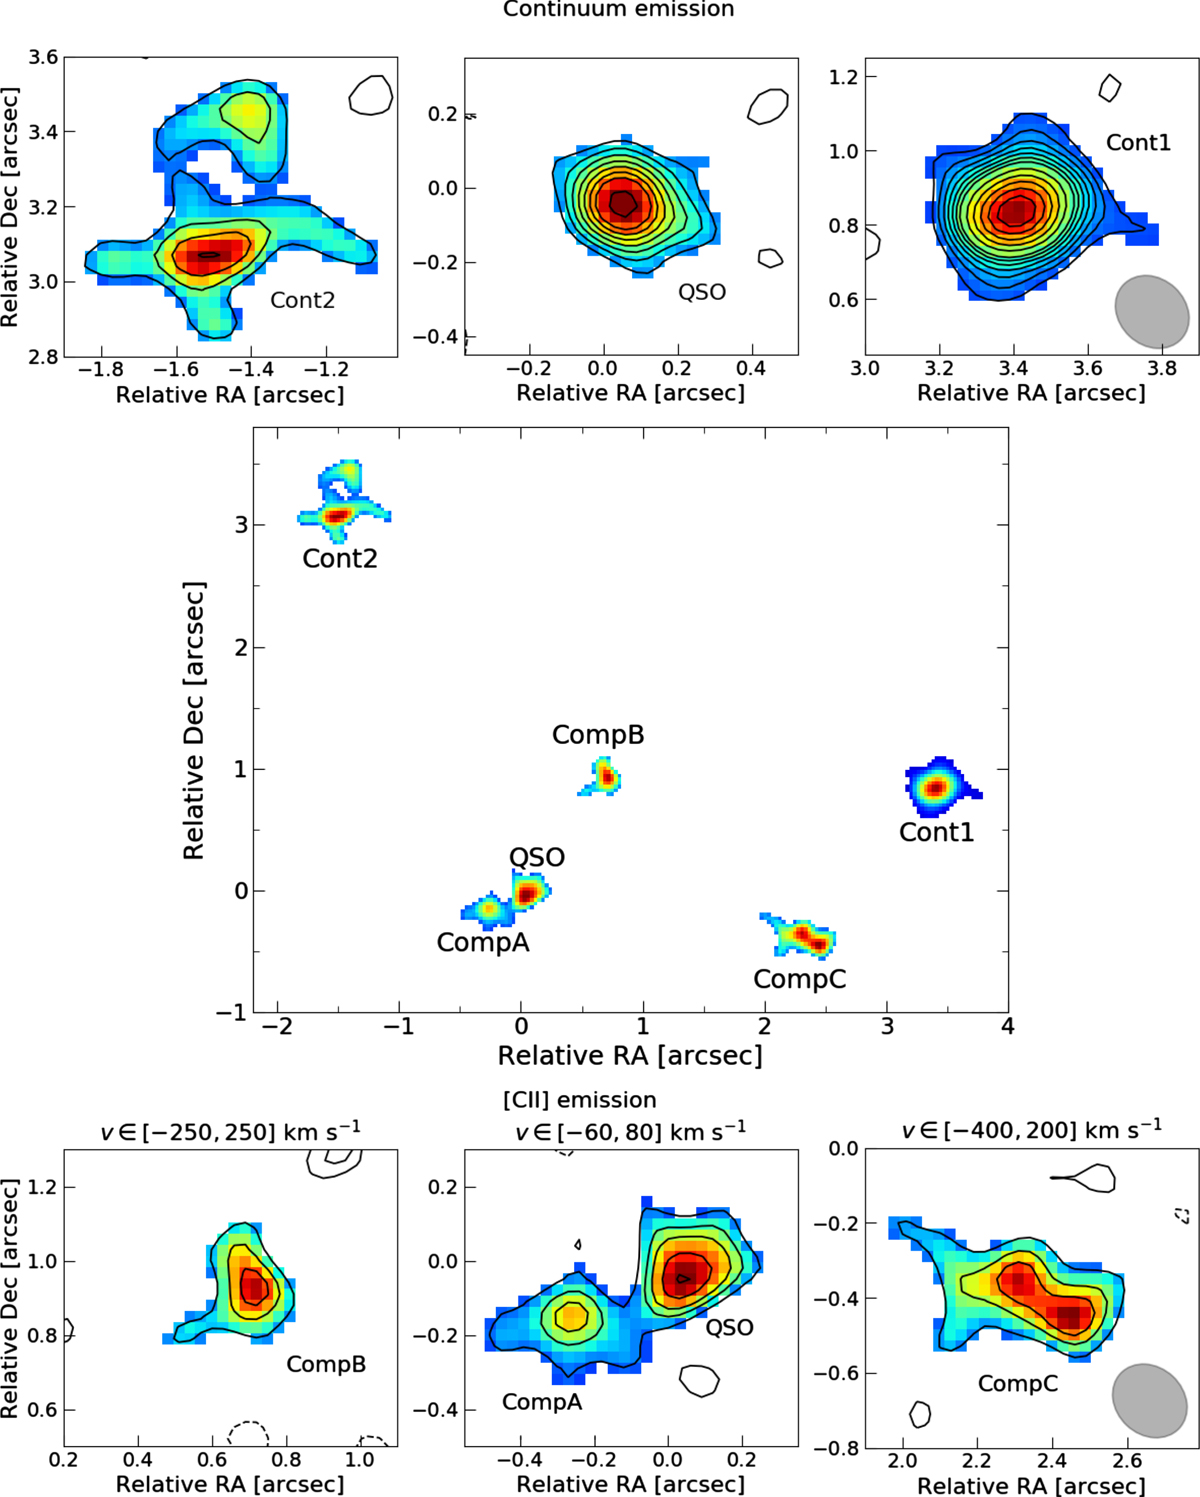
Continuum and [CII] line emission maps of J1015+0020 and the other sources detected in the ALMA FOV. Top panel: continuum emission maps of the QSO, Cont1, and Cont2 sources. Contours range from 2σ to 8σ in steps of 1σ (0.04 mJy beam−1), while above 8σ are in steps of 0.16 mJy beam−1. Middle panel: spatial distribution of all the detected sources, where coordinates are relative to the QSO location. Bottom panel: [CII] emission maps of the QSO and companion sources CompA, CompB, and CompC. Each map is integrated over the velocity range indicated above the panel. Contours are shown as in top panel with σ = 0.060, 0.027, 0.070 Jy beam−1 km s−1 in the left, middle, and right panel, respectively. Dashed contours refer to −2σ. The ALMA beam is shown as a grey ellipse.
Current usage metrics show cumulative count of Article Views (full-text article views including HTML views, PDF and ePub downloads, according to the available data) and Abstracts Views on Vision4Press platform.
Data correspond to usage on the plateform after 2015. The current usage metrics is available 48-96 hours after online publication and is updated daily on week days.
Initial download of the metrics may take a while.