Fig. 2.
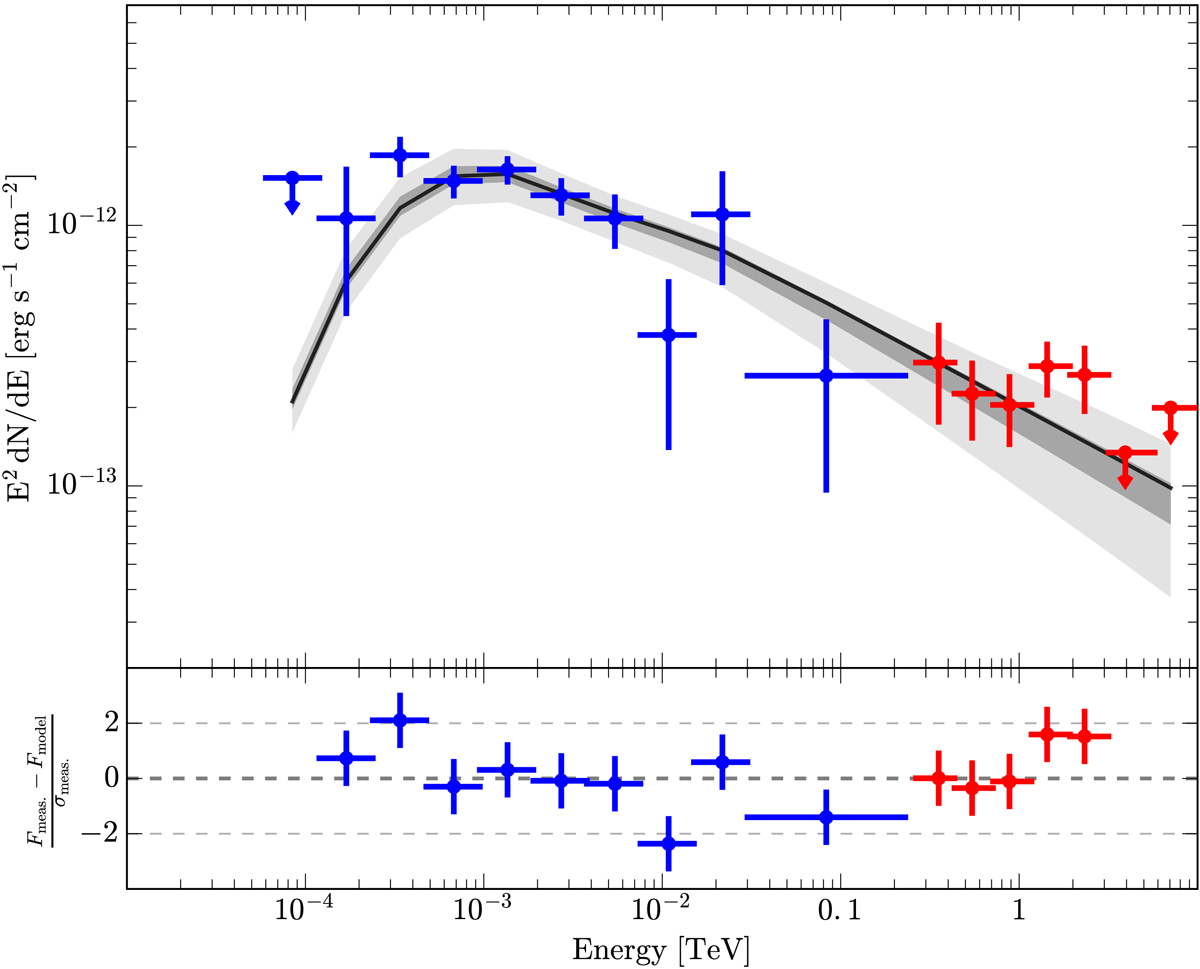
The γ-ray SED obtained with H.E.S.S. and Fermi–LAT are shown together. In addition, the best-fit γ-ray spectrum from pion decay of inelastically scattered protons is shown as a black solid line. The grey shaded areas highlight the 1 and 3σ confidence regions of the fit. The lower panel shows the residuals of the measurement with respect to the best fit, normalised to the measurements statistical uncertainty. Blue and red data points correspond again to the measurements obtained with Fermi–LAT and H.E.S.S., respectively.
Current usage metrics show cumulative count of Article Views (full-text article views including HTML views, PDF and ePub downloads, according to the available data) and Abstracts Views on Vision4Press platform.
Data correspond to usage on the plateform after 2015. The current usage metrics is available 48-96 hours after online publication and is updated daily on week days.
Initial download of the metrics may take a while.