Fig. 1.
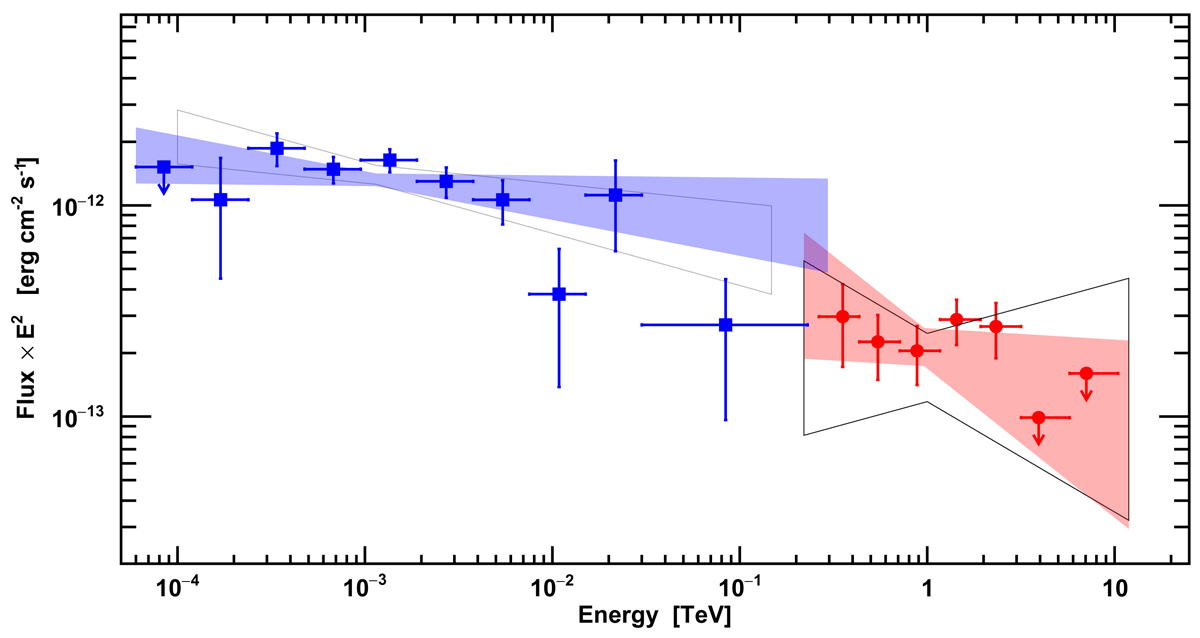
H.E.S.S. and Fermi–LAT pass 8 γ-ray SEDs are shown in red and blue, respectively. All error bars represent 1σ statistical uncertainties. The upper limits are given at 95% confidence level. The red shaded area represents the 1σ confidence region of the H.E.S.S. fit with combined statistical and systematic uncertainties. The black box shows the 1σ confidence region of the H.E.S.S. fit from HESS12. The grey box shows the Fermi–LAT 3FGL best fit. We note that the Fermi–LAT measurement uncertainties are dominated by the low statistics. The systematic error of the Fermi–LAT points range from 5 to 20%. The blue area shows the best fit power-law to the Fermi–LAT pass 8 data.
Current usage metrics show cumulative count of Article Views (full-text article views including HTML views, PDF and ePub downloads, according to the available data) and Abstracts Views on Vision4Press platform.
Data correspond to usage on the plateform after 2015. The current usage metrics is available 48-96 hours after online publication and is updated daily on week days.
Initial download of the metrics may take a while.