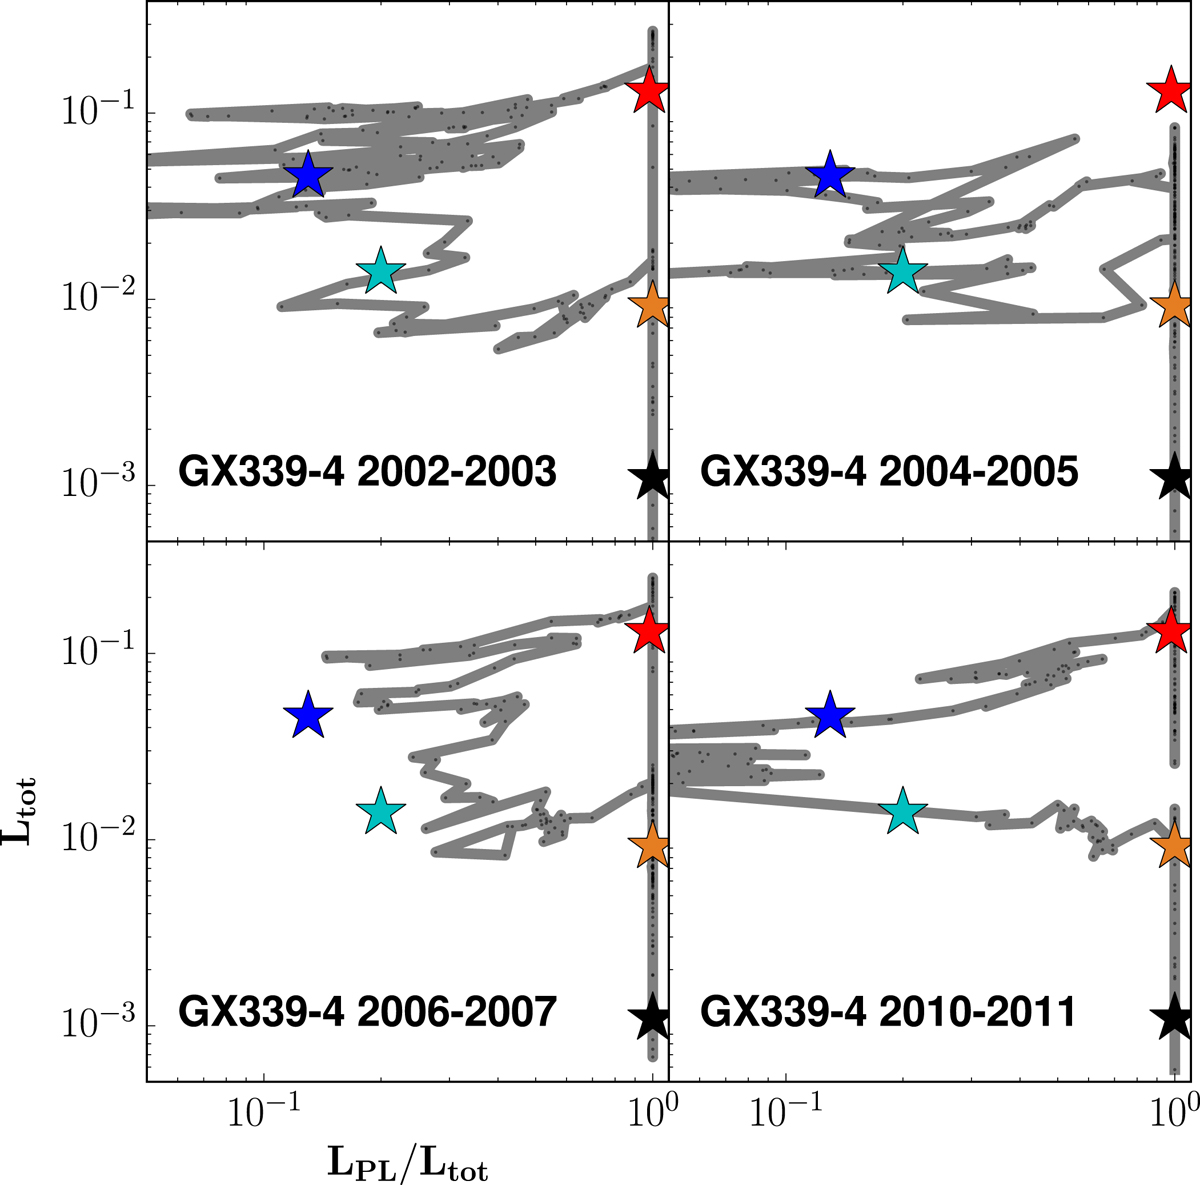
Fig. 8.

DFLDs for the past outbursts of GX 339–4 between MJD50290 and MJD55650 extrapolated in the 3–200 keV energy range. The spectral analysis of the 2010–2011 outburst was done in the 3–25 keV energy range (RXTE/PCA), but the models were integrated in the 3–200 keV range and not the usual ranges (e.g., Dunn et al. 2010). A typical cycle goes from Q (black), and crosses LH (orange) up to HH (red); it then transits to the HS (blue), decreases to LS (cyan) until it transits back to LH, before decreasing down to Q. The stars mark the positions of the five canonical spectral states Q, LH, HH, HS and LS defined in Sect. 4.4.
Current usage metrics show cumulative count of Article Views (full-text article views including HTML views, PDF and ePub downloads, according to the available data) and Abstracts Views on Vision4Press platform.
Data correspond to usage on the plateform after 2015. The current usage metrics is available 48-96 hours after online publication and is updated daily on week days.
Initial download of the metrics may take a while.


