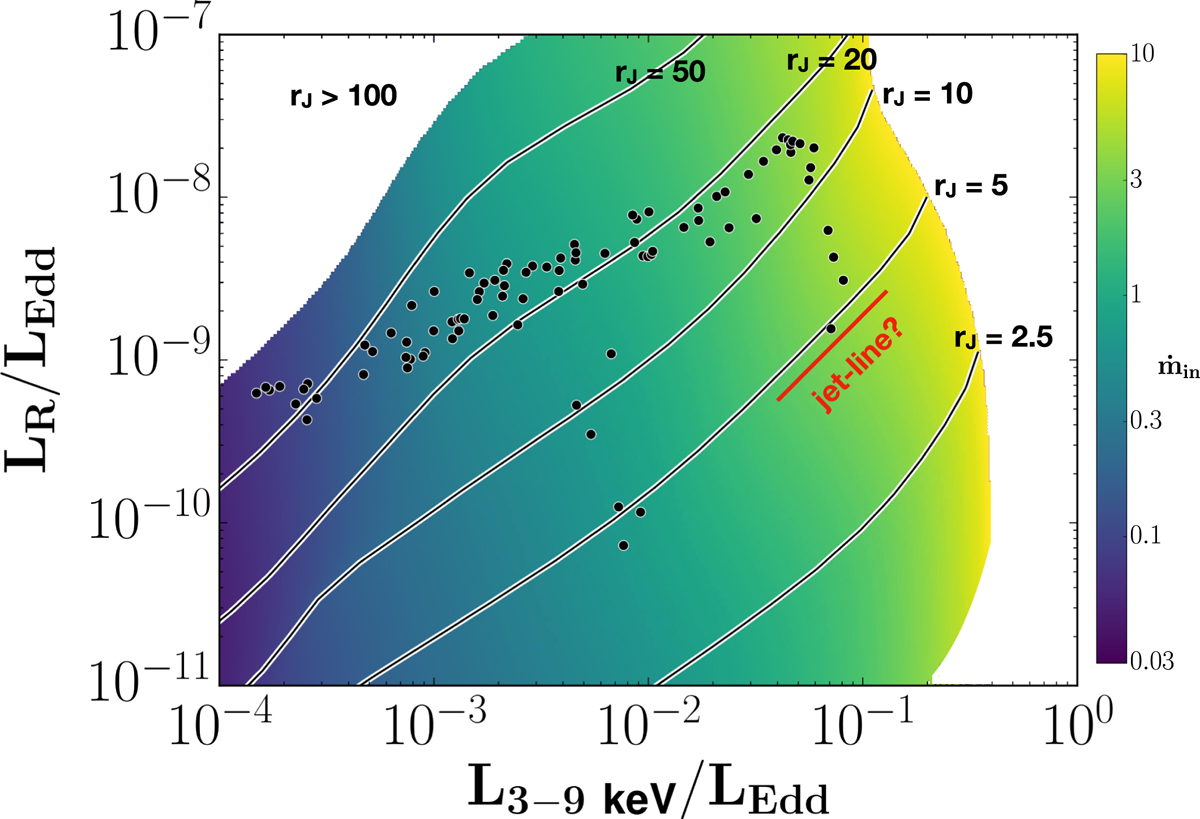
Fig. 7.

Power in the 8.6 GHz radio band in function of the 3–9 keV X-ray power (both in Eddington luminosity). Black solid lines are for constant transition radius rJ, while the color background shows the accretion rate ṁin. This figure has been made using a similar procedure to that used to make Fig. 5. The black points are the observed values for GX 339–4 during its cycles between 2003 and 2011. A possible theoretical jet line has been drawn in red (see Sect. 4.3).
Current usage metrics show cumulative count of Article Views (full-text article views including HTML views, PDF and ePub downloads, according to the available data) and Abstracts Views on Vision4Press platform.
Data correspond to usage on the plateform after 2015. The current usage metrics is available 48-96 hours after online publication and is updated daily on week days.
Initial download of the metrics may take a while.


