Fig. 5.

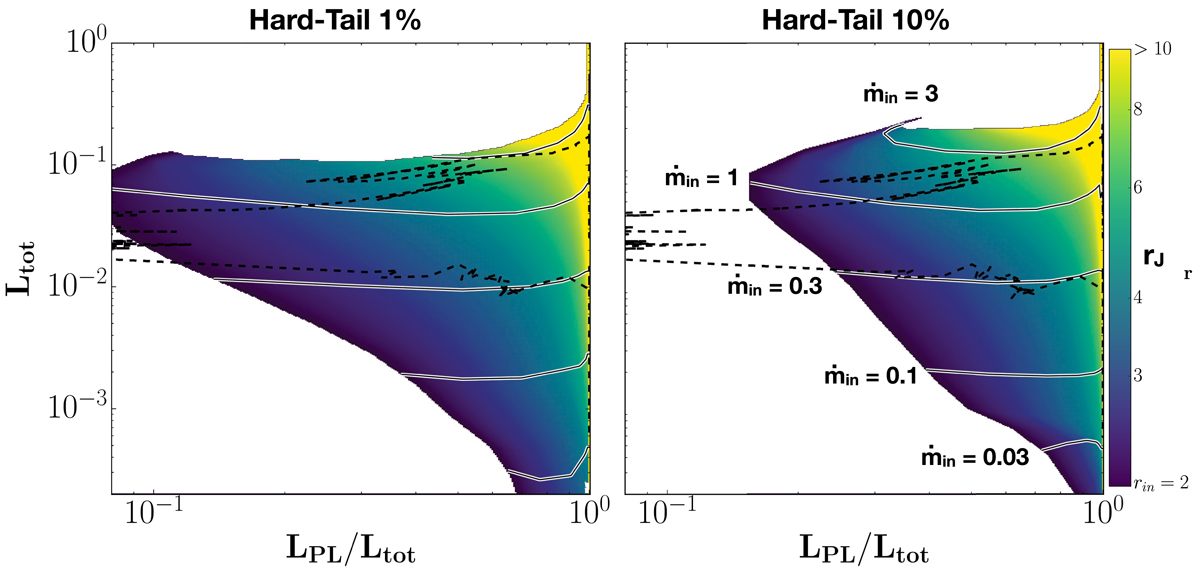
Total disk + power-law luminosity Ltot = Ldisk + LPL in the 3–200 keV energy range (in Eddington luminosity unit) is shown as a function of the power-law fraction LPL/Ltot. Each point within this plot corresponds to a fully computed and then XSPEC processed hybrid JED-SAD configuration. Contours (black solid lines) are for a constant disk accretion rate ṁin while the color background displays the disk transition radius rJ. Dashed black line shows the 2010–2011 cycle of GX 339–4. XSPEC fits were done with a hard tail level of 1% (left) and 10% (right). See Sect. 4.1 for a description of the figure.
Current usage metrics show cumulative count of Article Views (full-text article views including HTML views, PDF and ePub downloads, according to the available data) and Abstracts Views on Vision4Press platform.
Data correspond to usage on the plateform after 2015. The current usage metrics is available 48-96 hours after online publication and is updated daily on week days.
Initial download of the metrics may take a while.


