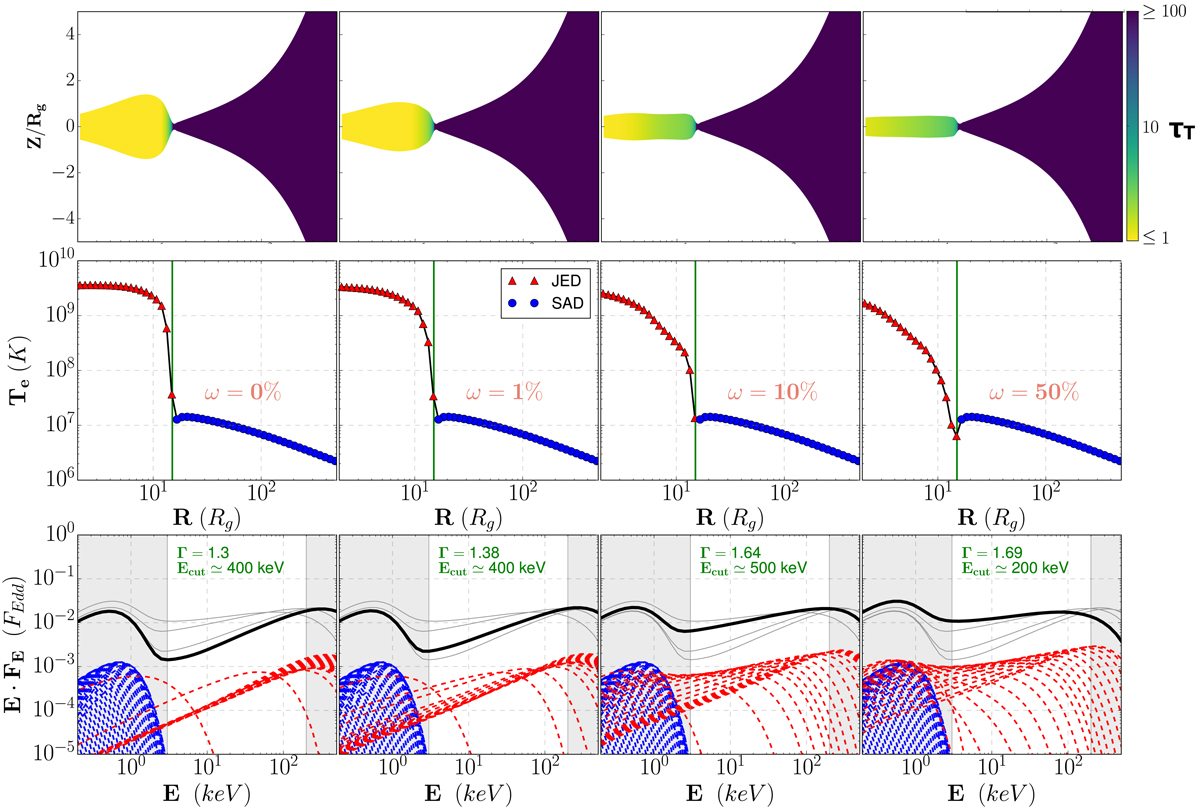
Fig. 2.

Effect of the external Comptonisation of the SAD photon field on the inner JED for ṁin = Ṁin/ṀEdd = 1 and rJ = 15 (green vertical line on the top figures), with different dilution factors, from left to right ω = 0, 1, 10, 50%. Top panels show the disk aspect as well as its Thomson optical depth in colors. Middle panels show the electron temperature as function of radius. Bottom panels display the local spectra emitted by each radius (dashed lines) and the corresponding total disk spectrum (black solid line). For comparison, in each panel we have overplotted the total spectra obtained in the other three panels in gray solid lines. The spectra are given in Eddington flux FEdd = LEdd/4πD2 units for GX 339–4 (see Sect. 2.1). The blue lines and dots correspond to the SAD zone, while the red lines and triangles represent the JED. The white part of the spectra shows the 3–200 keV energy range. Approximate values of the photon index Γ and energy cutoff Ecut, derived by comparison with a simple cutoff power-law model in this energy range, are indicated on each plot.
Current usage metrics show cumulative count of Article Views (full-text article views including HTML views, PDF and ePub downloads, according to the available data) and Abstracts Views on Vision4Press platform.
Data correspond to usage on the plateform after 2015. The current usage metrics is available 48-96 hours after online publication and is updated daily on week days.
Initial download of the metrics may take a while.


