Fig. 6
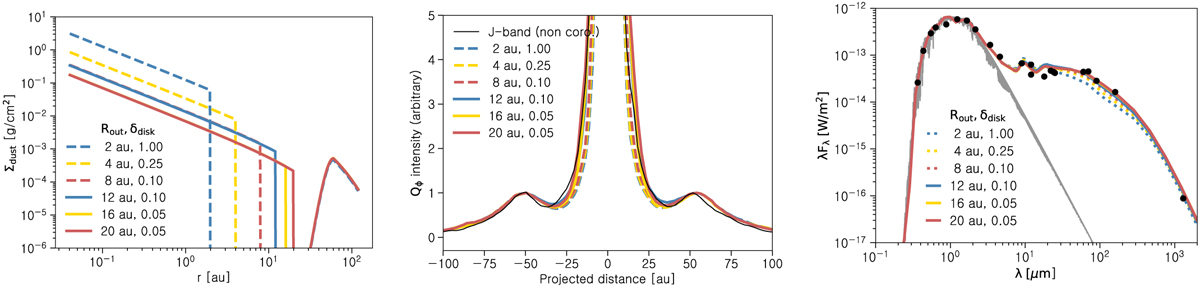
Left panel: surface density of our model for the small grains using different outer radii and depletion factors for the inner disk. Middle panel: cuts along the semi-major axis of model Qϕ images for different extents and depletion factors of the inner disk, in comparison with the observations (black line). Right panel: comparison of photometric measurements of PDS 70 (black points), and the synthetic spectra (coloured lines). The photometry was taken from Gregorio-Hetem et al. (1992), Cutri et al. (2003), and Hashimoto et al. (2012). Due to the low optical extinction towards PDS 70 (Pecaut & Mamajek 2016), no dereddening was applied to the optical and 2MASS photometric data. The grey line corresponds to the stellar model spectrum (K7 type) that we used for our RT calculations.
Current usage metrics show cumulative count of Article Views (full-text article views including HTML views, PDF and ePub downloads, according to the available data) and Abstracts Views on Vision4Press platform.
Data correspond to usage on the plateform after 2015. The current usage metrics is available 48-96 hours after online publication and is updated daily on week days.
Initial download of the metrics may take a while.