Fig. 4
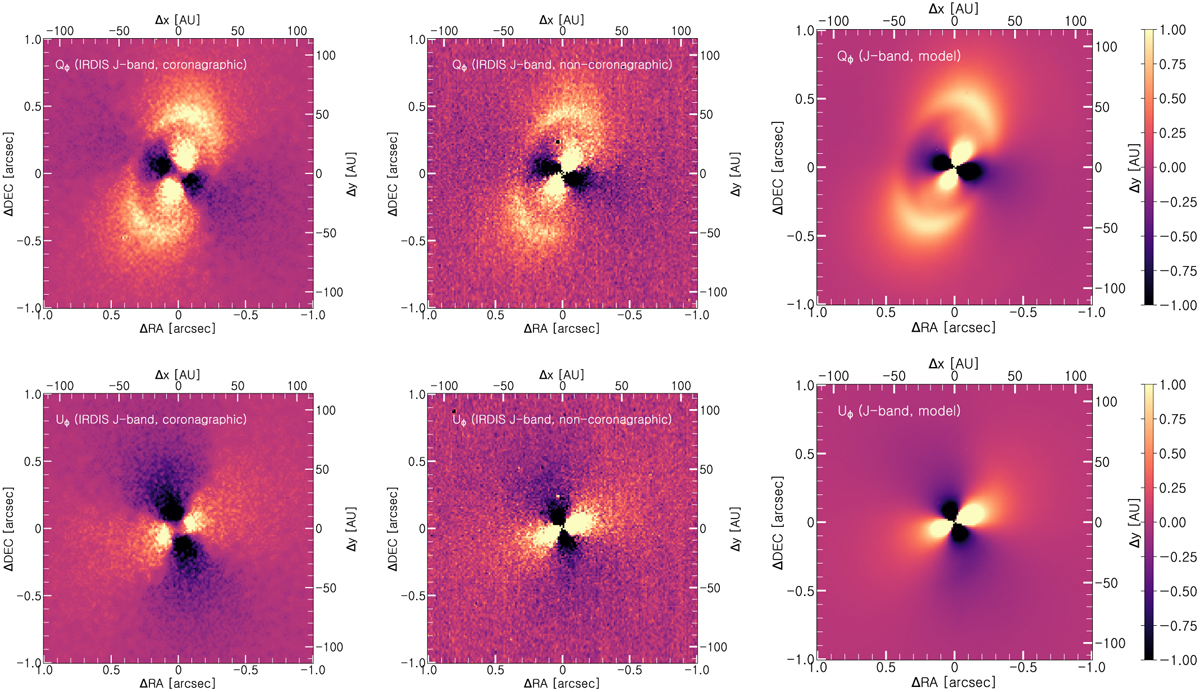
IRDIS coronagraphic (left column) and non-coronagraphic (middle column) PDI images, corrected for the instrumental polarisation but without subtracting the central source polarisation. The right column shows the model image as acomparison, including an inner disk with an outer radius of 2 au. The first row corresponds to the Qϕ images, the second row to the Uϕ images. North is up and east is to the left.
Current usage metrics show cumulative count of Article Views (full-text article views including HTML views, PDF and ePub downloads, according to the available data) and Abstracts Views on Vision4Press platform.
Data correspond to usage on the plateform after 2015. The current usage metrics is available 48-96 hours after online publication and is updated daily on week days.
Initial download of the metrics may take a while.