Fig. 2
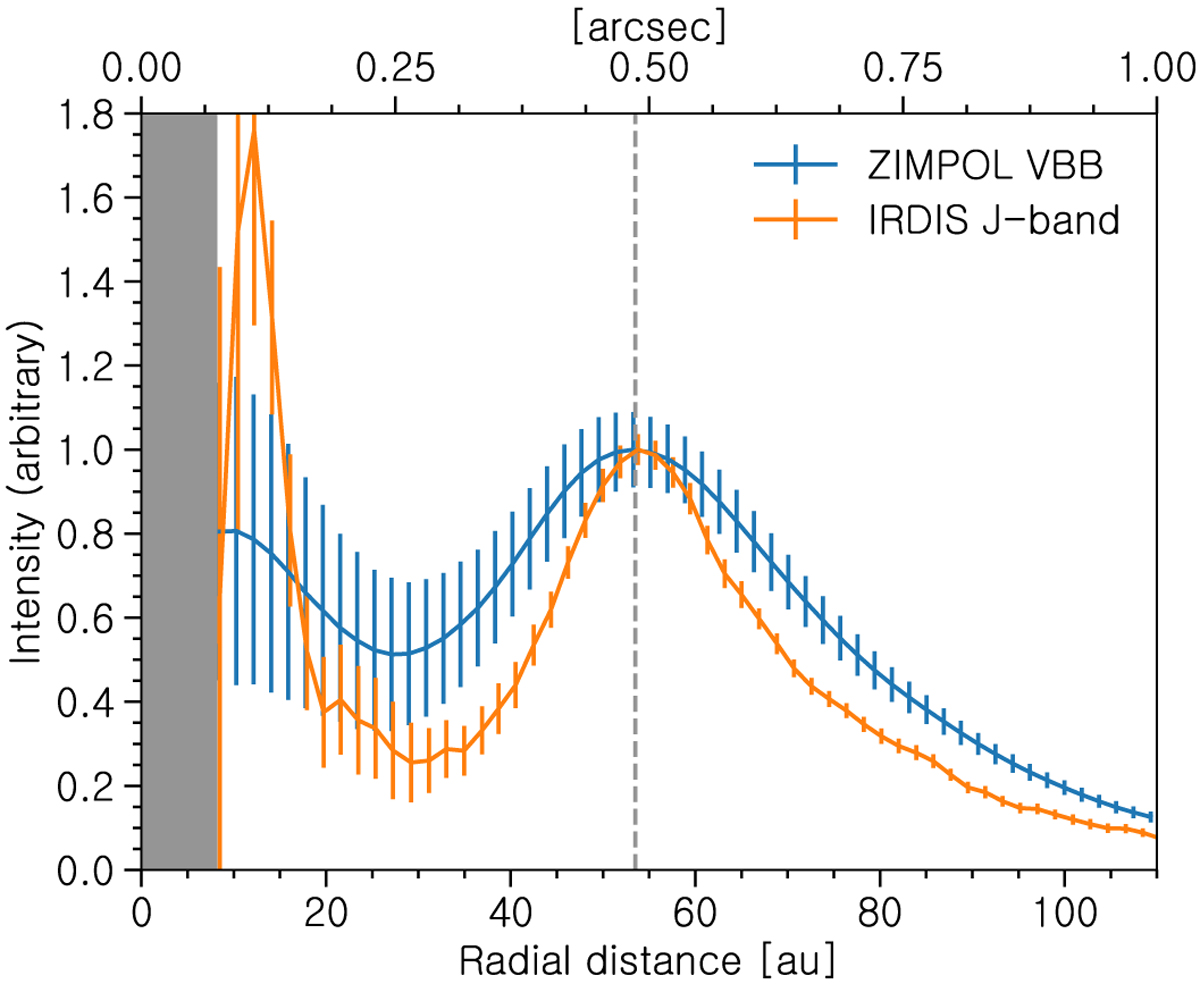
Radial profile of the VBB (blue) and J-band (orange) deprojected, azimuthally averaged Qϕ images. The profiles were normalized according to the brightness peak of the outer disk, whose location (~54 au) is indicated by the grey dashed line. The grey shadow indicates the radius of the coronagraph in the J-band observations(~8 au).
Current usage metrics show cumulative count of Article Views (full-text article views including HTML views, PDF and ePub downloads, according to the available data) and Abstracts Views on Vision4Press platform.
Data correspond to usage on the plateform after 2015. The current usage metrics is available 48-96 hours after online publication and is updated daily on week days.
Initial download of the metrics may take a while.