Fig. C.1
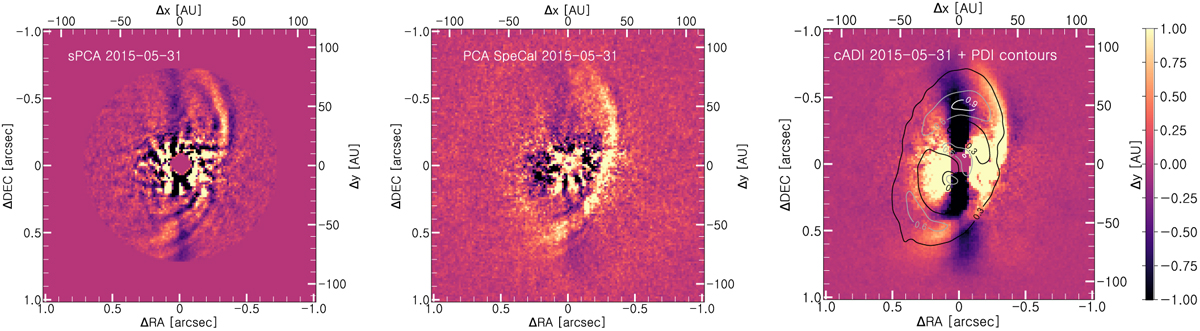
SHINE IRDIS observations of May 31, 2015: sPCA reduction (left panel), PCA-SpeCal reduction(middle panel), and cADI with an contour overlay of the PDI coronagraphic J-band image (rightpanel). The contours are drawn with respect to the peak value of the PDI image. For visibility purposes, the images are shown on individual colourscales. North is up and east is to the left.
Current usage metrics show cumulative count of Article Views (full-text article views including HTML views, PDF and ePub downloads, according to the available data) and Abstracts Views on Vision4Press platform.
Data correspond to usage on the plateform after 2015. The current usage metrics is available 48-96 hours after online publication and is updated daily on week days.
Initial download of the metrics may take a while.