Fig. A.1
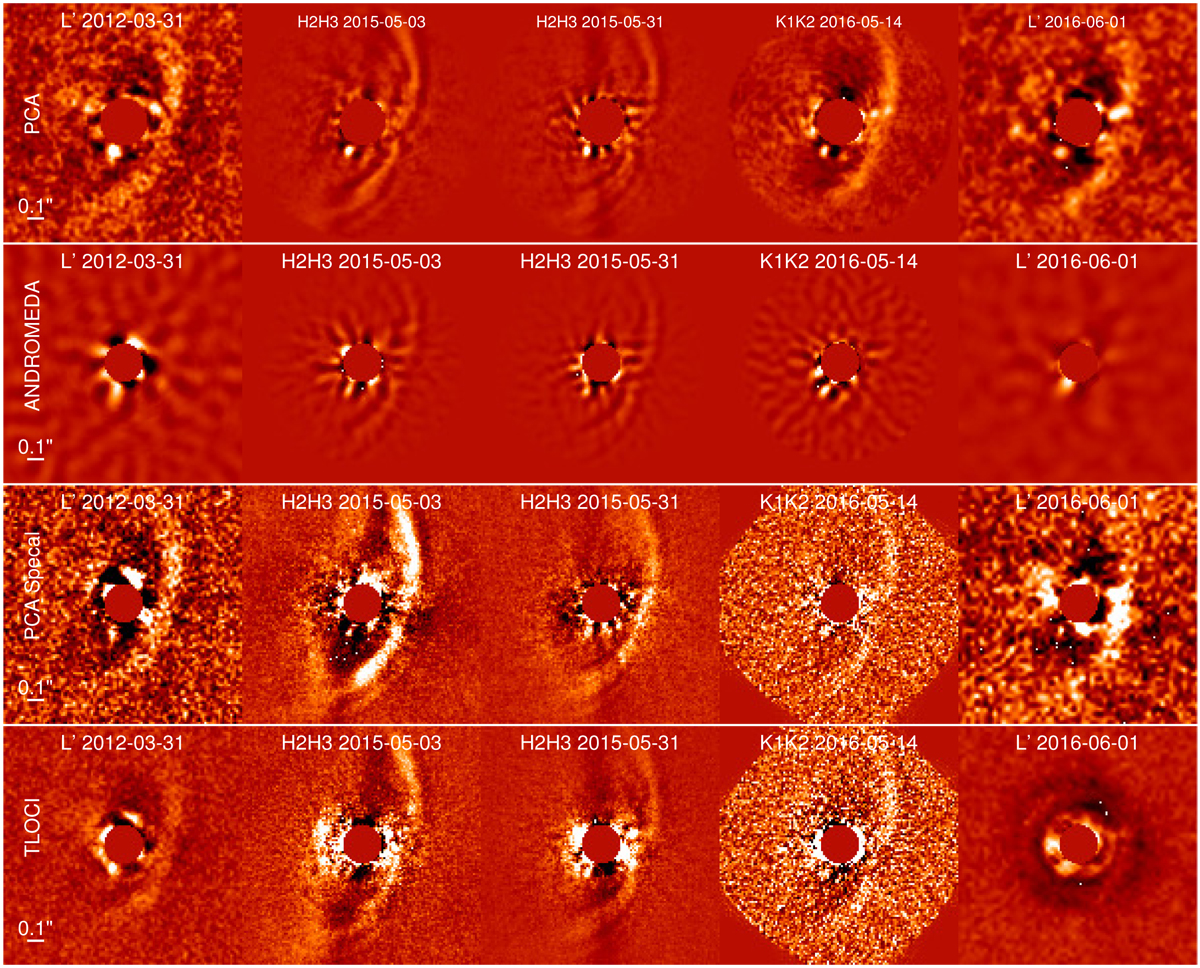
Contrast maps of the point source detection as retrieved with the sPCA reduction (first row), ANDROMEDA (second row), PCA SpeCal (third row), and TLOCI (fourth row). From left to right: NICI L′ -band (2012-03-31), IRDIS H2H3-band (2015-05-03), IRDIS H2H3-band (2015-05-31), IRDIS K1K2-band (2016-05-14), NaCo L′ -band (2016-06-01). The sPCA images were smoothed with a Gaussian kernel of size 0.5 × FWHM. North is up and east is to the left. The brightness levels were adapted individually for visibility purposes.
Current usage metrics show cumulative count of Article Views (full-text article views including HTML views, PDF and ePub downloads, according to the available data) and Abstracts Views on Vision4Press platform.
Data correspond to usage on the plateform after 2015. The current usage metrics is available 48-96 hours after online publication and is updated daily on week days.
Initial download of the metrics may take a while.