Fig. 13
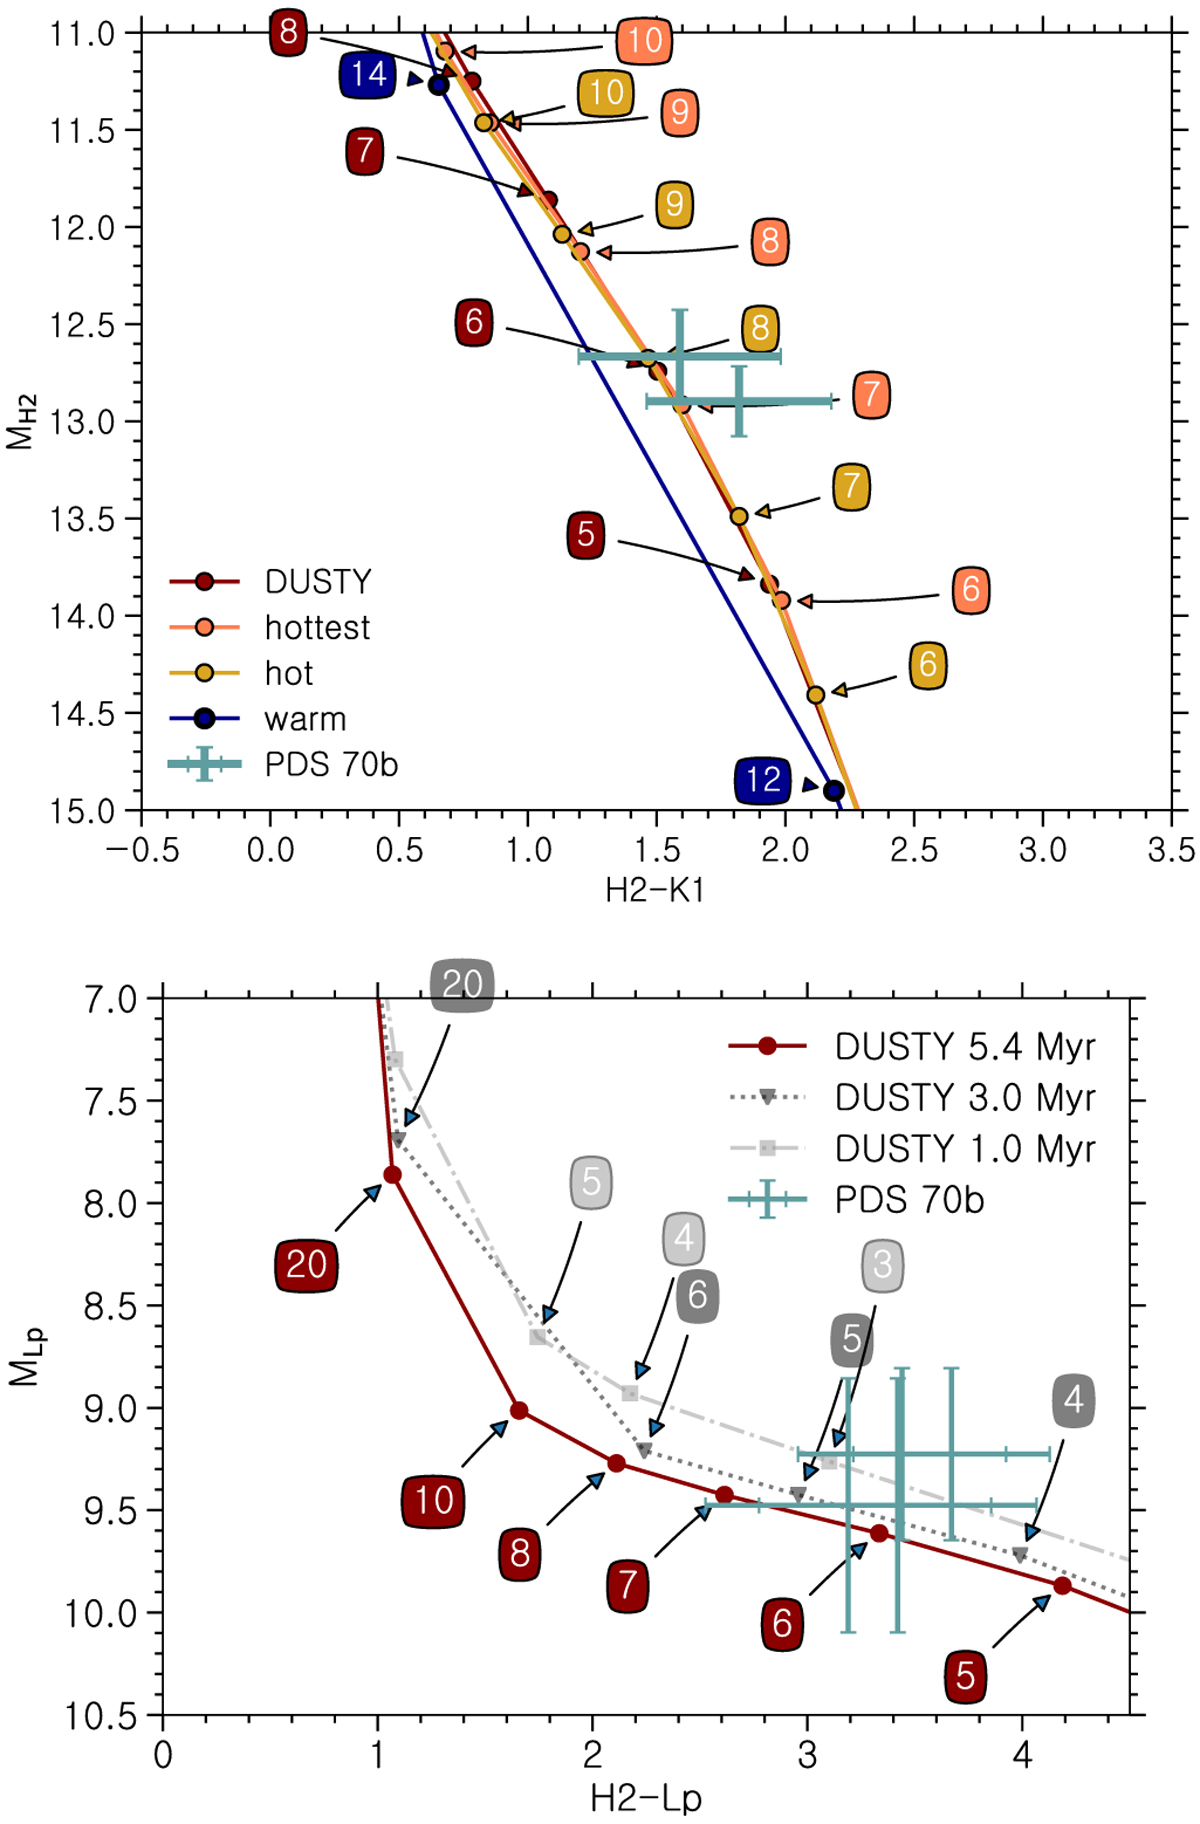
Photometry of PDS 70b in comparison with evolutionary models, evaluated at an age of 5.4 Myr. The green crosses mark the measurements corresponding to the different H2 and L′ epochs. Upper panel: “hottest”, “hot”, and “warm” models from Mordasini et al. (2017), as well as the DUSTY model in a H2 vs. H2-K1 diagram. The lower panel compares the L′ vs. H2-L′ colour of the DUSTY model with the measured photometry. The corresponding masses in units of MJup are indicated bythe coloured labels.
Current usage metrics show cumulative count of Article Views (full-text article views including HTML views, PDF and ePub downloads, according to the available data) and Abstracts Views on Vision4Press platform.
Data correspond to usage on the plateform after 2015. The current usage metrics is available 48-96 hours after online publication and is updated daily on week days.
Initial download of the metrics may take a while.