Fig. 12
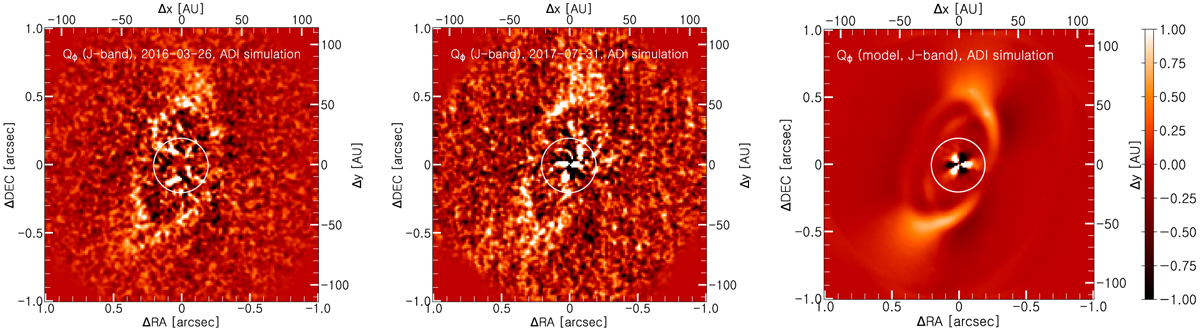
cADI simulation for the Qϕ images of the coronagraphic (left) and non-coronagraphic (middle) J-band observations, after subtracting the central source polarisation. The right panel shows the same simulation for our model image. This image was generated by convolving the Stokes Q and U images with a real IRDIS J-band PSF, computing the Qϕ and Uϕ images, subtracting the central source polarisation by applying a Uϕ minimisation, and finally applying the cADI algorithm. The model included the presence of an inner disk with an outer radius of 2 au. The white circle marks a radial distance of 200 mas, approximately the separation of the companion. The colour stretch was adaptedindividually for visibility purposes. North is up and east is to the left.
Current usage metrics show cumulative count of Article Views (full-text article views including HTML views, PDF and ePub downloads, according to the available data) and Abstracts Views on Vision4Press platform.
Data correspond to usage on the plateform after 2015. The current usage metrics is available 48-96 hours after online publication and is updated daily on week days.
Initial download of the metrics may take a while.