Fig. A.2.
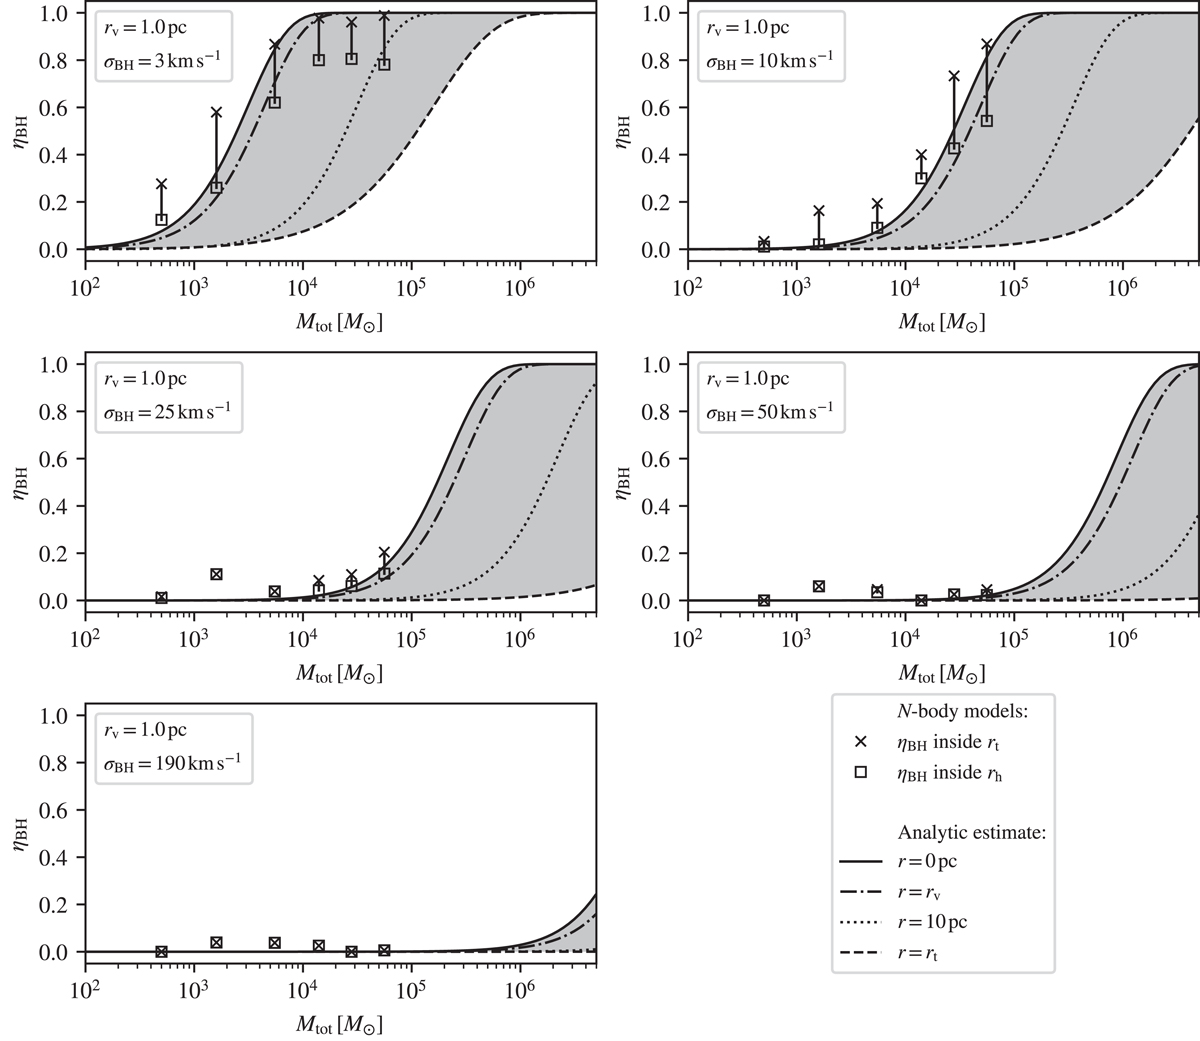
A comparison of the retention fraction from the N-body models (with rv = 1.0 pc) with the analytic estimate. The limits from our analytic estimate, Eq. (6), are represented by a shaded area delimiting the escape radius from 0 pc (solid line) to the tidal radius (dashed line) determined from Eq. (4). We also include the curve for an escape radius of 10 pc (dotted line) and the virial radius (dashdotted line). The squares and crosses represent the retention fraction from our numerical simulations in the half-mass and tidal radius, respectively.
Current usage metrics show cumulative count of Article Views (full-text article views including HTML views, PDF and ePub downloads, according to the available data) and Abstracts Views on Vision4Press platform.
Data correspond to usage on the plateform after 2015. The current usage metrics is available 48-96 hours after online publication and is updated daily on week days.
Initial download of the metrics may take a while.