Free Access
Fig. A.1.
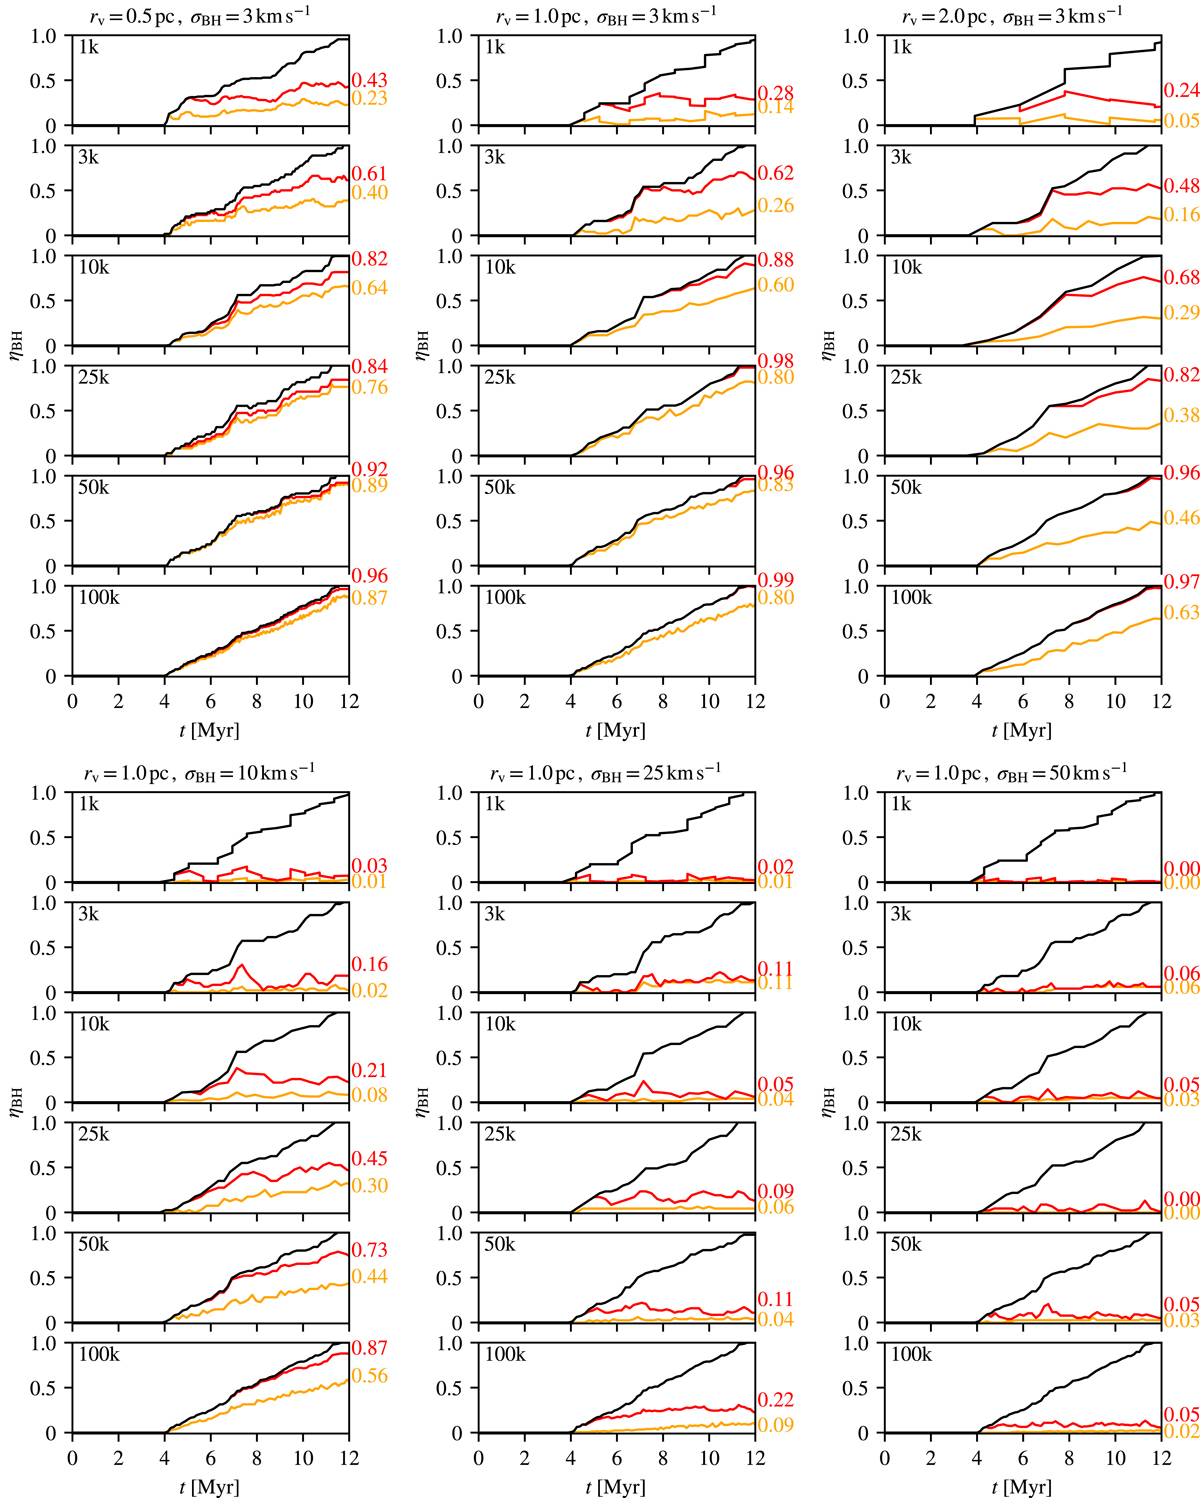
Evolution of the retention fraction, ηBH, within the half-mass radius (orange) and the tidal radius (red). The black line shows the ratio of BHs that have formed with respect to the final number of BHs in the cluster. The curves for 1k and 10k models are averaged over 100 and 10 realisations, respectively.
Current usage metrics show cumulative count of Article Views (full-text article views including HTML views, PDF and ePub downloads, according to the available data) and Abstracts Views on Vision4Press platform.
Data correspond to usage on the plateform after 2015. The current usage metrics is available 48-96 hours after online publication and is updated daily on week days.
Initial download of the metrics may take a while.