Fig. 7
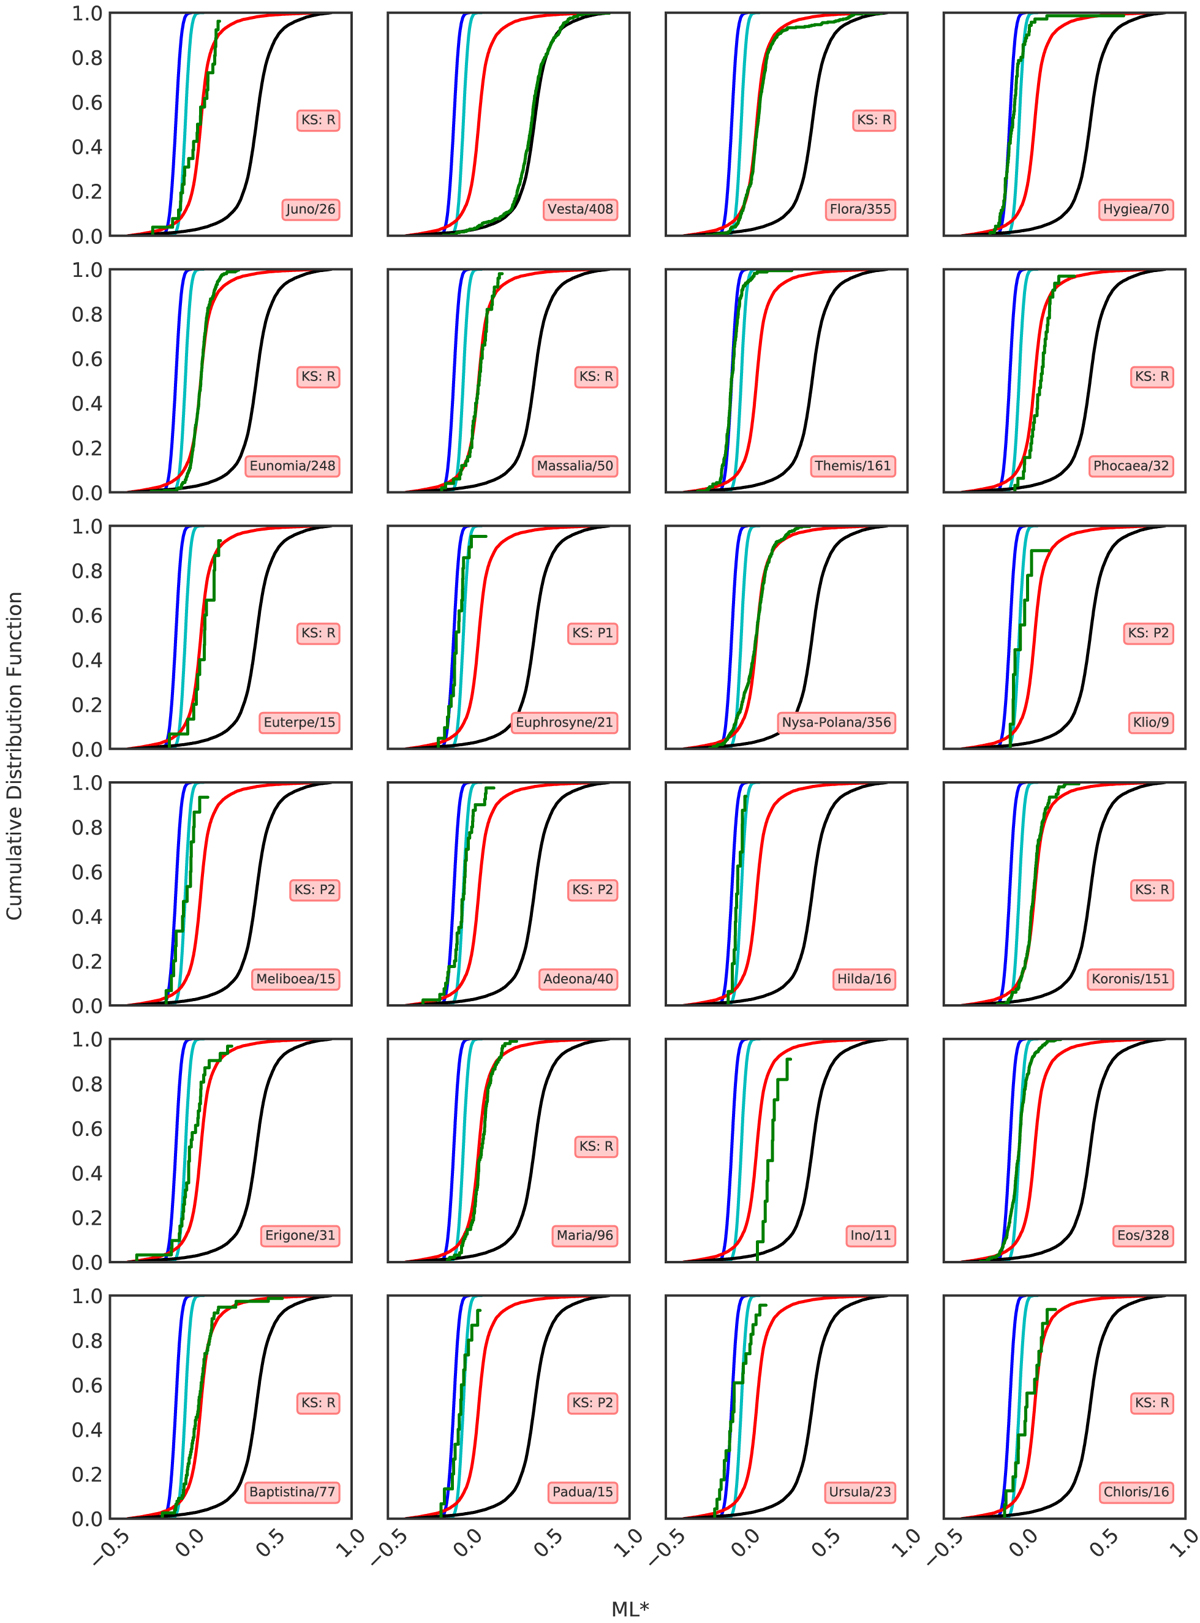
Cumulative distribution functions (CDFs) for all the families with NOBS ≥ 8 observed in MOVIS and ![]() (green), together with the theoretical distributions computed in Sect. 3.1: dark blue for P1, light blue for P2, red for the rocky population, and black for the basaltic population. Each plot includes the family name and the number of asteroids from the family used to run the KS-test. In addition, we marked every family associated with a single population (determined via the KS-test).
(green), together with the theoretical distributions computed in Sect. 3.1: dark blue for P1, light blue for P2, red for the rocky population, and black for the basaltic population. Each plot includes the family name and the number of asteroids from the family used to run the KS-test. In addition, we marked every family associated with a single population (determined via the KS-test).
Current usage metrics show cumulative count of Article Views (full-text article views including HTML views, PDF and ePub downloads, according to the available data) and Abstracts Views on Vision4Press platform.
Data correspond to usage on the plateform after 2015. The current usage metrics is available 48-96 hours after online publication and is updated daily on week days.
Initial download of the metrics may take a while.