Fig. 6
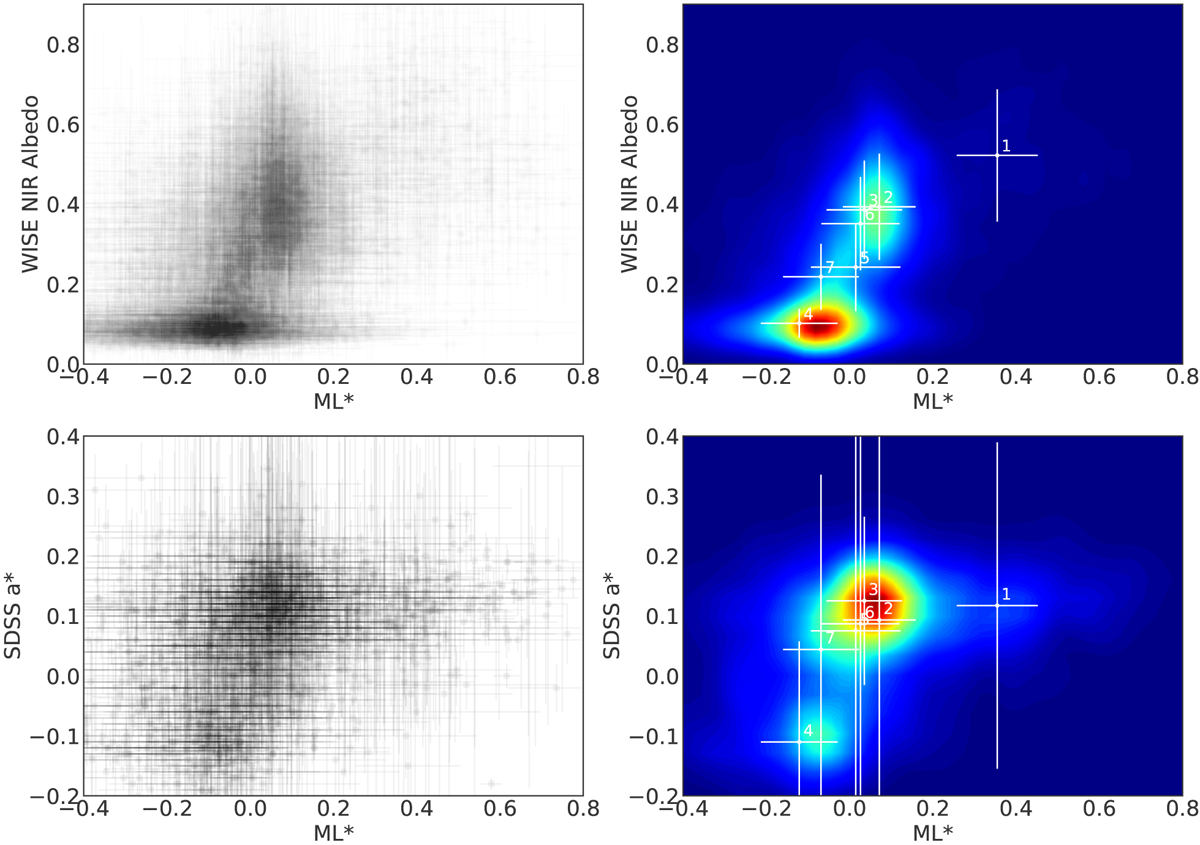
Top: scatter plot (left) and corresponding weighted density plot (right) of the computed ML* from this work and near-infrared albedo values from NEOWISE, for a total of 8746 objects. Bottom: same as top panels, but for the computed a* from SDSS MOC (2210 objects). Overplotted in white are the points (with their error bars) corresponding to the mean values of these parameters for some of the families observed within MOVIS: 1 – Vesta, 2 – Flora, 3 – Eunomia, 4 – Themis, 5 – Nysa–Polana, 6 – Koronis, 7 – Eos.
Current usage metrics show cumulative count of Article Views (full-text article views including HTML views, PDF and ePub downloads, according to the available data) and Abstracts Views on Vision4Press platform.
Data correspond to usage on the plateform after 2015. The current usage metrics is available 48-96 hours after online publication and is updated daily on week days.
Initial download of the metrics may take a while.