Fig. 4
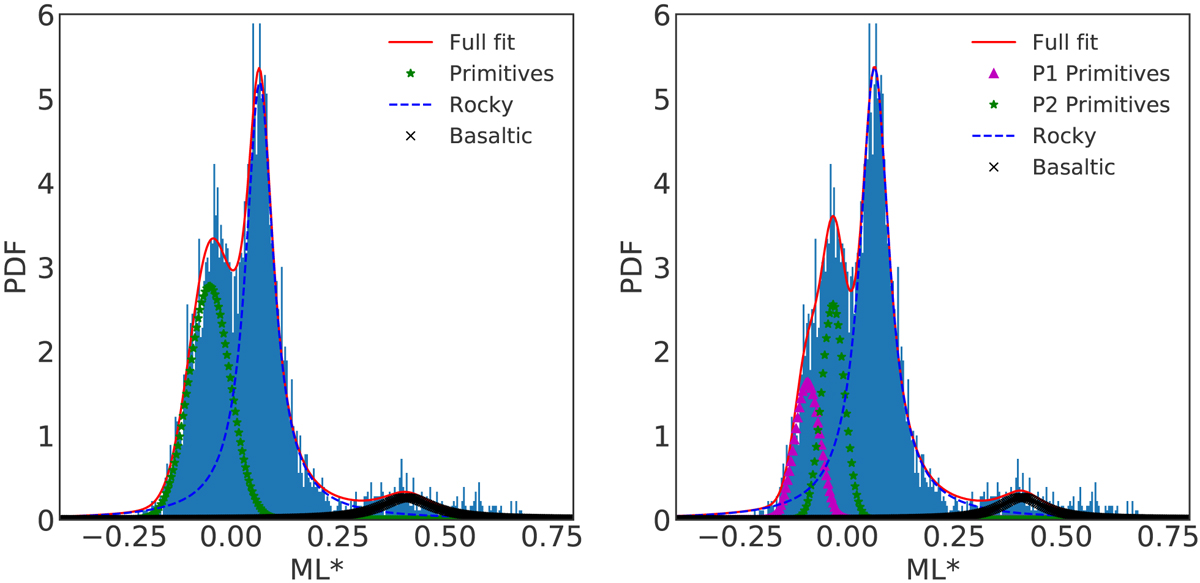
Histograms and fits for the ML* distribution. We have used only those objects presenting an error in the computation of ML* smaller than the first quartile of the full sample (![]() ). A total of4566 objects were used for these fits. In the left panel we show the fitting results for the case with only three distributions (primitive, rocky, and basaltic). The right plot shows the fitting results when we introduce an additional primitive population. This last case provides the best fit. The red line corresponds to the combination of all the populations used for the fits. See Table 2 for the computed mean ML* values and their corresponding standard deviations for these four groups. We note that for the P1 and P2 populations ML* < 0, while for the rocky and basaltic populations ML* > 0.
). A total of4566 objects were used for these fits. In the left panel we show the fitting results for the case with only three distributions (primitive, rocky, and basaltic). The right plot shows the fitting results when we introduce an additional primitive population. This last case provides the best fit. The red line corresponds to the combination of all the populations used for the fits. See Table 2 for the computed mean ML* values and their corresponding standard deviations for these four groups. We note that for the P1 and P2 populations ML* < 0, while for the rocky and basaltic populations ML* > 0.
Current usage metrics show cumulative count of Article Views (full-text article views including HTML views, PDF and ePub downloads, according to the available data) and Abstracts Views on Vision4Press platform.
Data correspond to usage on the plateform after 2015. The current usage metrics is available 48-96 hours after online publication and is updated daily on week days.
Initial download of the metrics may take a while.