Fig. 3
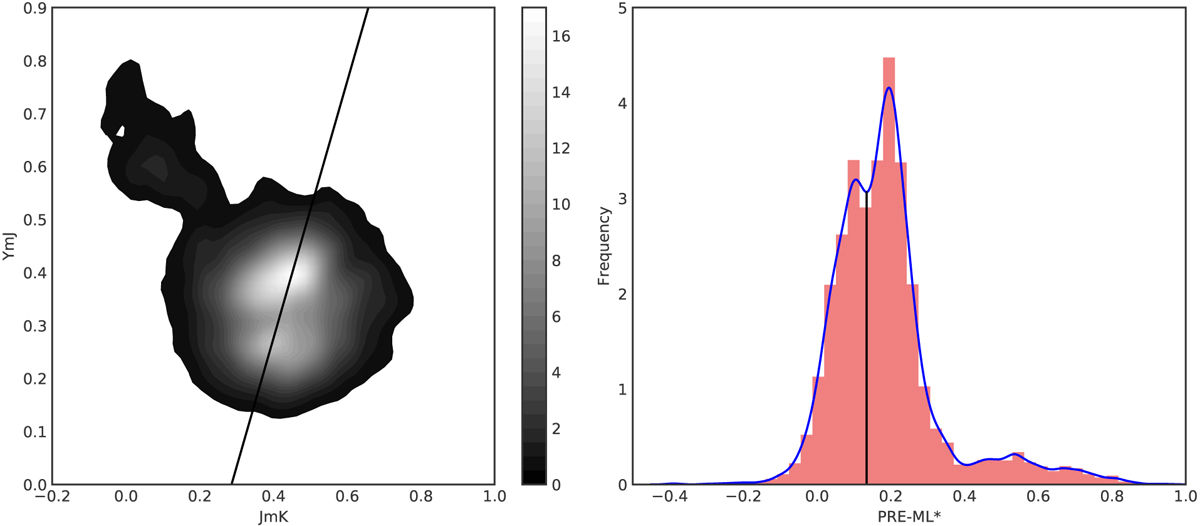
Graphical representation of the procedure followed to parametrize the near-infrared colors in MOVIS. The left panel shows the kernel density estimation plot of the J− Ks (JmK) vs. Y −J (YmJ) distributions. Brighter regions correspond to higher density of points. The straight line connects the two main cluster centers (peaks of maximum density). The third cluster (Y − J >0.5) corresponds to basaltic asteroids (Popescu et al. 2016). The right panel shows the univariate PDF estimation for the ML* before the computation of the required offset to set the separation between the rocky and primitive asteroids clusters at the origin. The vertical black line indicates the point where the PDF density is minimum between the two maxima. We used the C0.10 subset for this example.
Current usage metrics show cumulative count of Article Views (full-text article views including HTML views, PDF and ePub downloads, according to the available data) and Abstracts Views on Vision4Press platform.
Data correspond to usage on the plateform after 2015. The current usage metrics is available 48-96 hours after online publication and is updated daily on week days.
Initial download of the metrics may take a while.