Fig. C.1
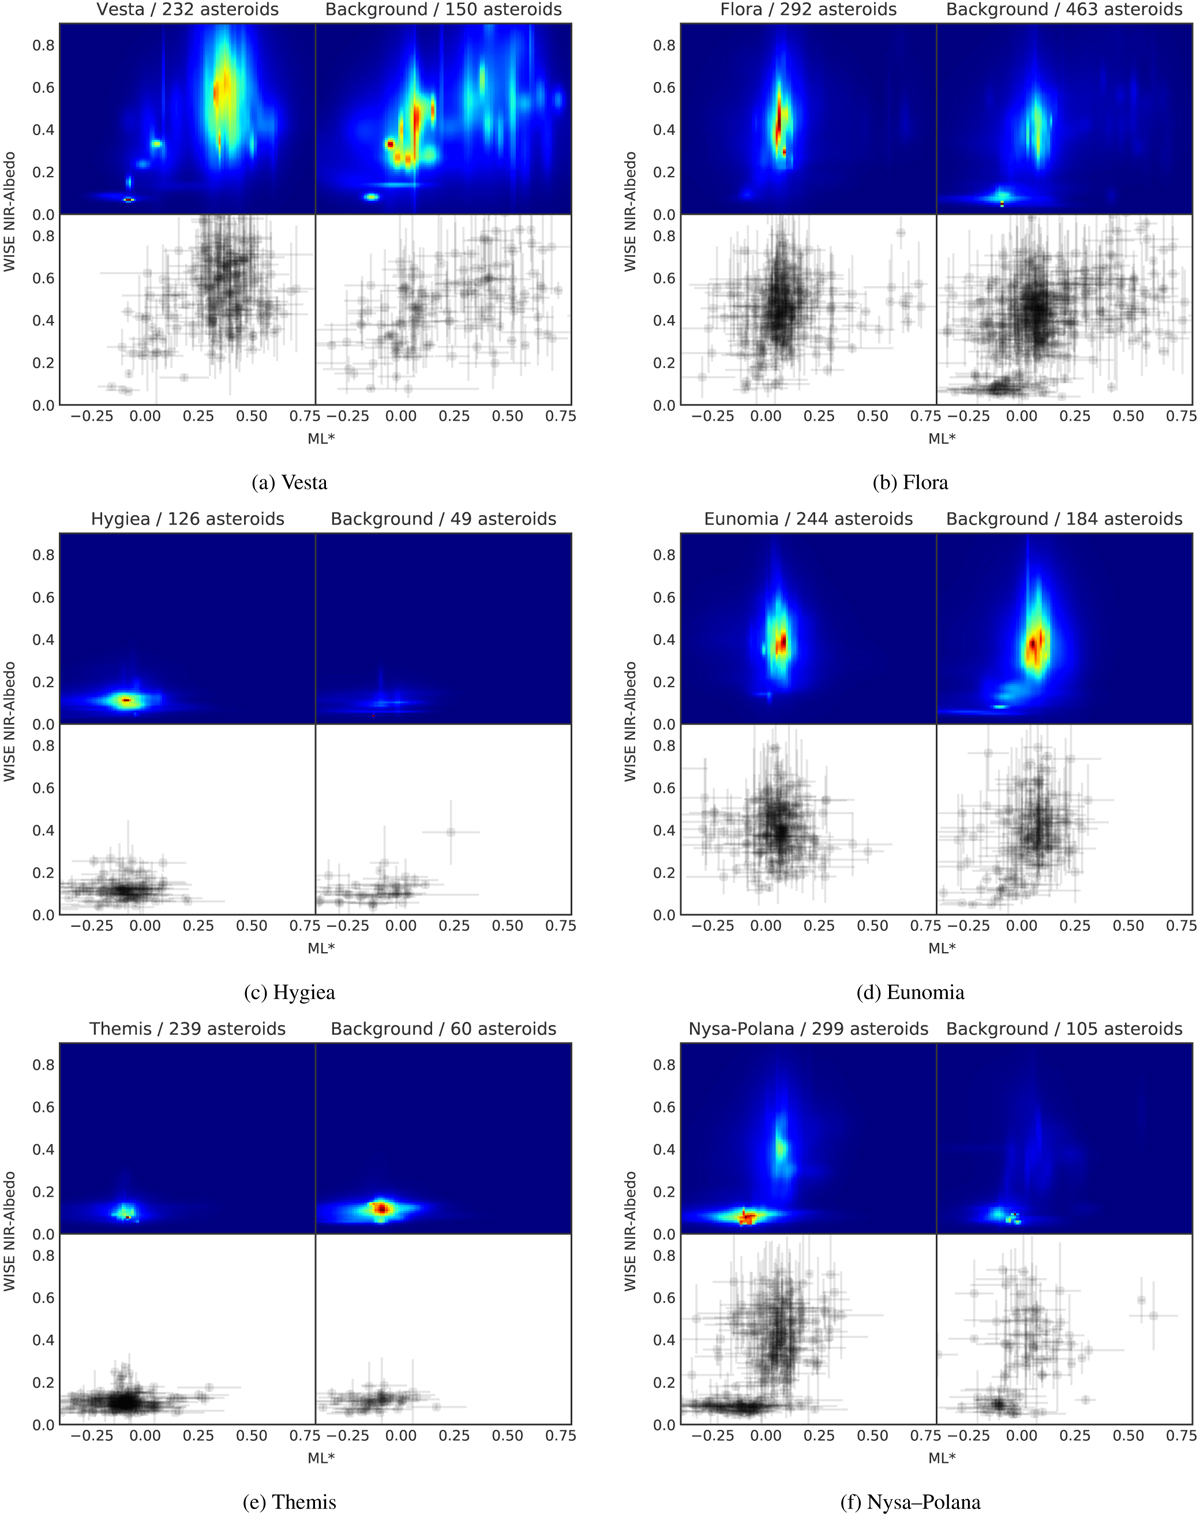
Asteroid families detected within the MOVIS catalog, with at least 40 coincidences with NEOWISE, and with a background of at least ten asteroids. In these plots we represent ML* vs. pNIR. On the left, we represent the observed family, and on the right the background we defined for that same family. Upper plots are weighted density plots (see text for explanation), and lower plots are scatter representations of the observed asteroids, with the corresponding error bars.
Current usage metrics show cumulative count of Article Views (full-text article views including HTML views, PDF and ePub downloads, according to the available data) and Abstracts Views on Vision4Press platform.
Data correspond to usage on the plateform after 2015. The current usage metrics is available 48-96 hours after online publication and is updated daily on week days.
Initial download of the metrics may take a while.