Fig. B.1
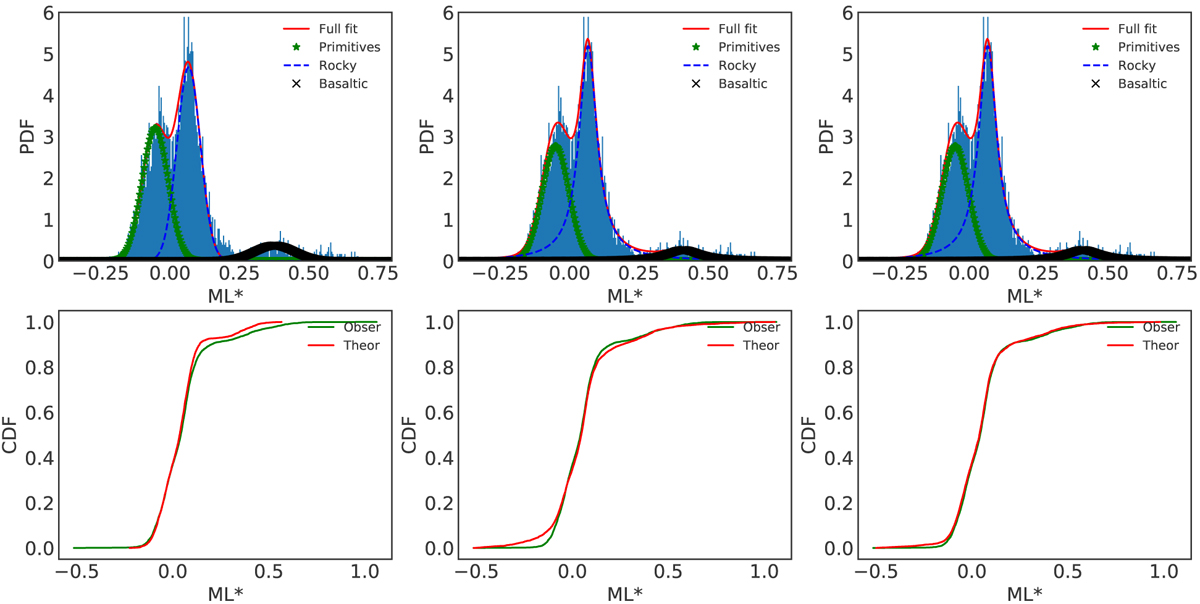
Graphical representation of the results of the fits for the case where we assumed three distributions: three Gaussians (left), three Lorentzians (center), one Gaussian for the primitive population and two Lorentzians for both rocky and basaltic populations (right). The upper plots represent the probability density functions associated with the ML* distributions. The lower plots are the corresponding cumulative distribution functions.
Current usage metrics show cumulative count of Article Views (full-text article views including HTML views, PDF and ePub downloads, according to the available data) and Abstracts Views on Vision4Press platform.
Data correspond to usage on the plateform after 2015. The current usage metrics is available 48-96 hours after online publication and is updated daily on week days.
Initial download of the metrics may take a while.