Fig. 9
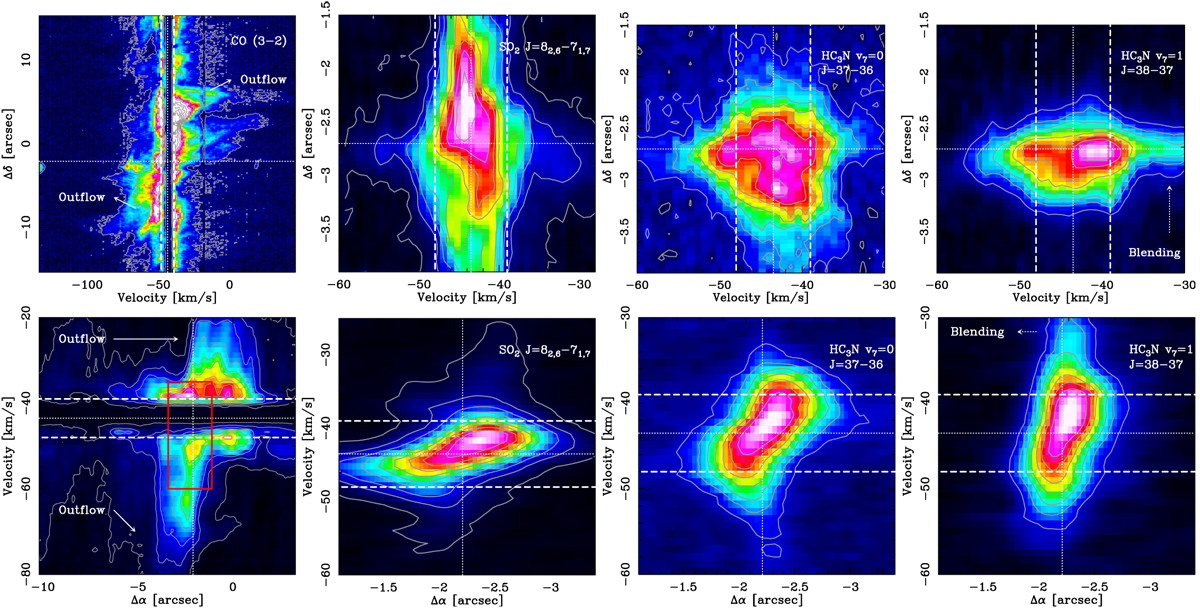
pv-diagrams along the Δδ axis and averaged over the extent of the cube (top row) and along the Δ α axis (bottom row) of the CO (3–2), SO2, HC3 N (J = 37–36), and HC3N v7 = 1 (J = 38–37) transitions from left to right panels, respectively. The dotted lines show the vlsr of the source and the position of the dust continuum peak. The dashed lines indicate velocities of vlsr ± 4.5 km s−1, roughly corresponding to the velocities of the CH3OH peaks. The red rectangle in the lower left panel corresponds to the region shown in the other panels. The contours start at 20% of the peak and increase by 10%, except for the panel of the CO and SO2 lines, where the lowest contours start at 5% of the peak.
Current usage metrics show cumulative count of Article Views (full-text article views including HTML views, PDF and ePub downloads, according to the available data) and Abstracts Views on Vision4Press platform.
Data correspond to usage on the plateform after 2015. The current usage metrics is available 48-96 hours after online publication and is updated daily on week days.
Initial download of the metrics may take a while.