Fig. 7
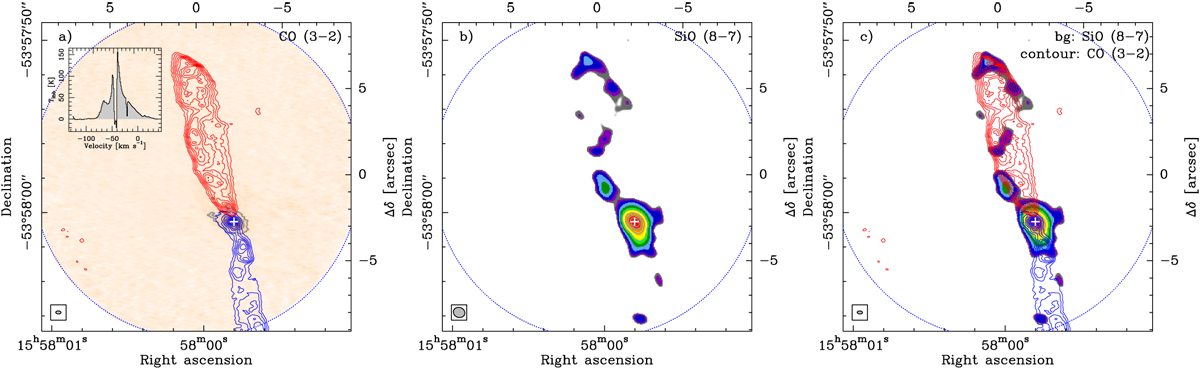
Panel a: Colour scale showing the continuum emission from Fig. 1, panel b. The contours show the CO (3–2) integrated emission between − 80 and − 65 km s−1 for the blue, and between − 30 and + 36 km s−1 for the red, respectively. The white cross marks the position of the dust continuum peak. The inset shows a spectrum of the integrated emission over the area of the lowest contours. Panel b: the contours show the velocity-integrated SiO (8–7) emission starting from 4σ (1σ = 0.26 Jy beam−1 km s−1), and increase by 2σ levels. Panel c: overlay of the CO (3–2) contours on the velocity-integrated SiO (8–7) emission shown in panel b. The beam is shown in the lower left corner of each panel. In panel c, it corresponds to that of the CO (3–2) map.
Current usage metrics show cumulative count of Article Views (full-text article views including HTML views, PDF and ePub downloads, according to the available data) and Abstracts Views on Vision4Press platform.
Data correspond to usage on the plateform after 2015. The current usage metrics is available 48-96 hours after online publication and is updated daily on week days.
Initial download of the metrics may take a while.