Fig. 6
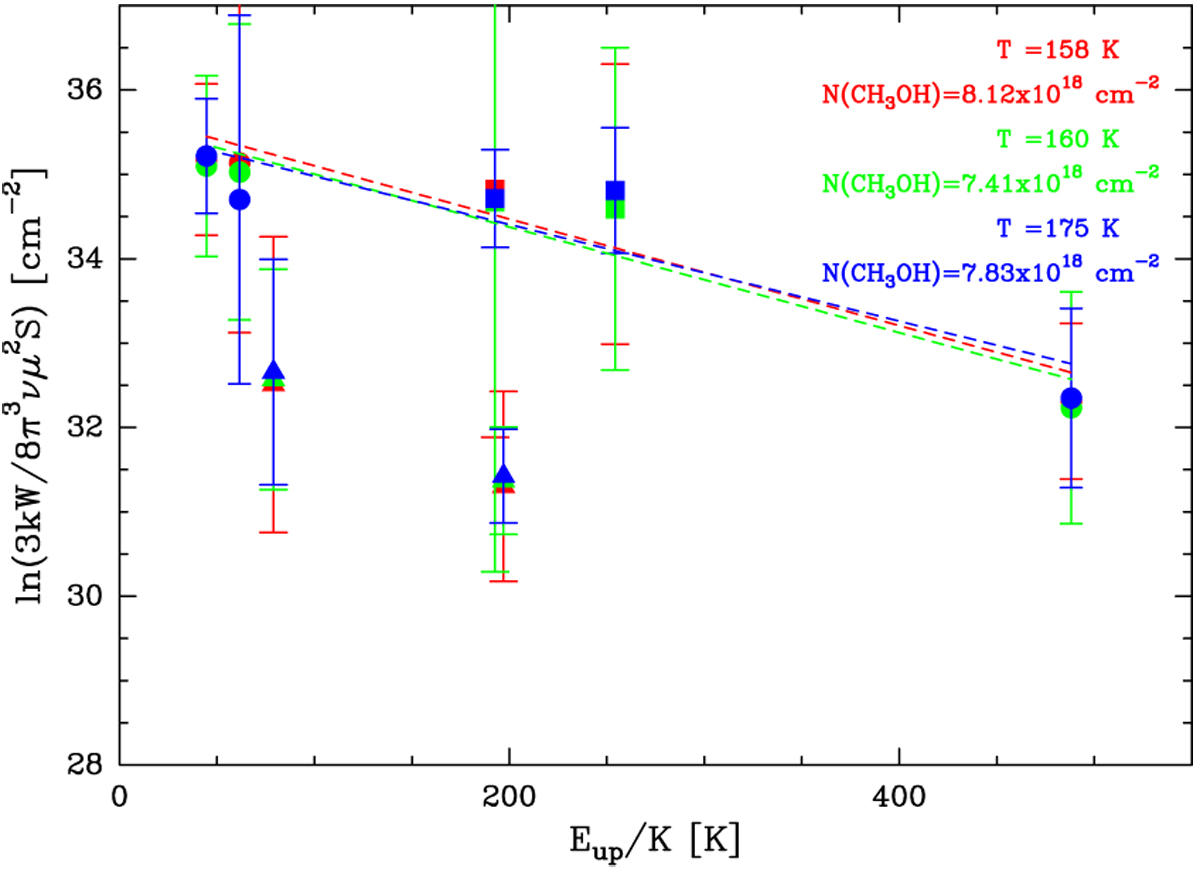
Rotational diagram of the CH3OH (and isotopologue) transitions from Table 1. The colours correspond to the measurements on different positions: green shows the position marked A, red shows the position marked B, and blue corresponds to the central position marked by a cross in Fig. 4. The filled circles show the CH3 OH lines, squares represent the 13CH3OH lines, and triangles show the optically thick lines that are not used for the fit. The error bars show the linearly propagated errors from the Gaussian fit to the integrated intensities.
Current usage metrics show cumulative count of Article Views (full-text article views including HTML views, PDF and ePub downloads, according to the available data) and Abstracts Views on Vision4Press platform.
Data correspond to usage on the plateform after 2015. The current usage metrics is available 48-96 hours after online publication and is updated daily on week days.
Initial download of the metrics may take a while.