Fig. 5
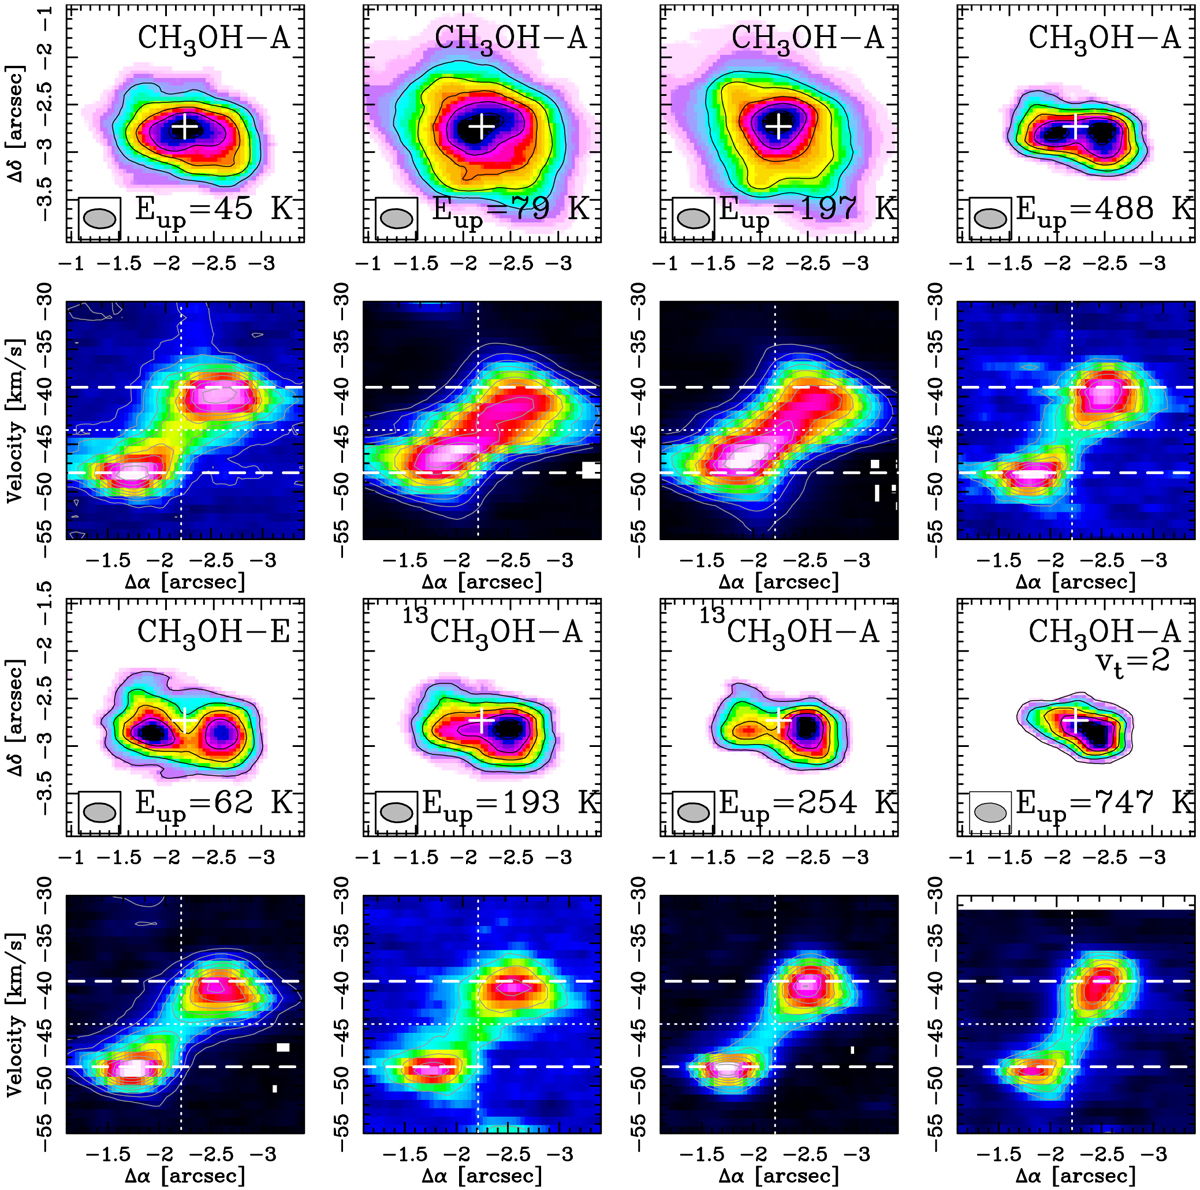
CH3OH zeroth-moment map and pv-diagrams for the transitions listed in Table 1. The top row shows the zeroth-moment map calculated over a velocity range of [−55, −30] km s−1; contours start at 30% of the peak and increase by 15%. The white cross marks the position of the continuum peak. The beam is shown in the lower left corner. The symmetry of the methanol molecule is labelled ineach panel, as well as the upper level energy of the transition. The subsequent row shows the pv-diagram along the Δα axis and averaged over the extent of the cube, corresponding to ~2.5′′. The right-ascension offset of the continuum peak and the vlsr velocity of the source are marked with a white dotted line. Dashed lines show vlsr ± 4.5 km s−1, corresponding to the peak velocity of the CH3OH spots.
Current usage metrics show cumulative count of Article Views (full-text article views including HTML views, PDF and ePub downloads, according to the available data) and Abstracts Views on Vision4Press platform.
Data correspond to usage on the plateform after 2015. The current usage metrics is available 48-96 hours after online publication and is updated daily on week days.
Initial download of the metrics may take a while.