Fig. 4
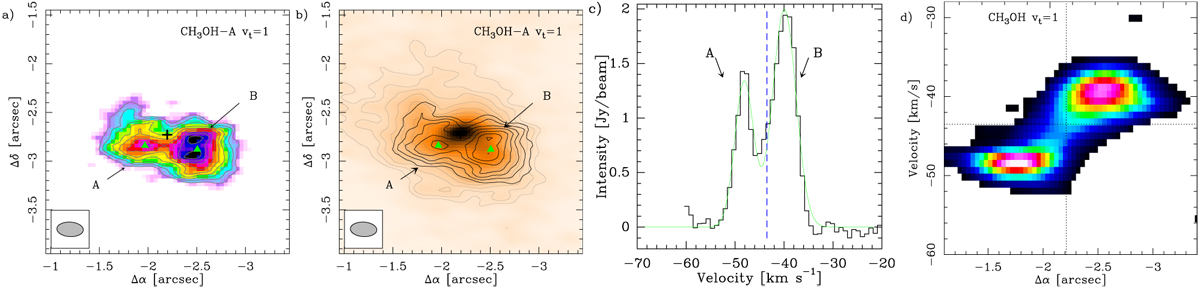
Panel a: Colour scale showing the integrated intensity map of the vt = 1 CH3 OH line at 334.4 GHz. The green triangles indicate the positions where the spectrum has been extracted for the rotational diagram analysis on the CH3OH spots, and are labelled as components A and B. The black cross marks the position of the dust continuum peak. The beam is shown inthe lower left corner. Panel b: the colour scale shows the continuum emission from Fig. 2b, contours and markers are the same as in panel a. Panel c: Integrated spectrum of the torsionally excited CH3 OH transition at 334.4 GHz over the area shown in panel a. The green lines show the two-component Gaussian fit to the spectrum. The blue dashed line shows the vlsr of the source. Panel d: pv-diagram along the Δα axis and averaged over the extent of the cube we show here corresponding to ~2.5′′. The dotted lines mark the position of the dust peak and the vlsr of the source.
Current usage metrics show cumulative count of Article Views (full-text article views including HTML views, PDF and ePub downloads, according to the available data) and Abstracts Views on Vision4Press platform.
Data correspond to usage on the plateform after 2015. The current usage metrics is available 48-96 hours after online publication and is updated daily on week days.
Initial download of the metrics may take a while.