Fig. 3
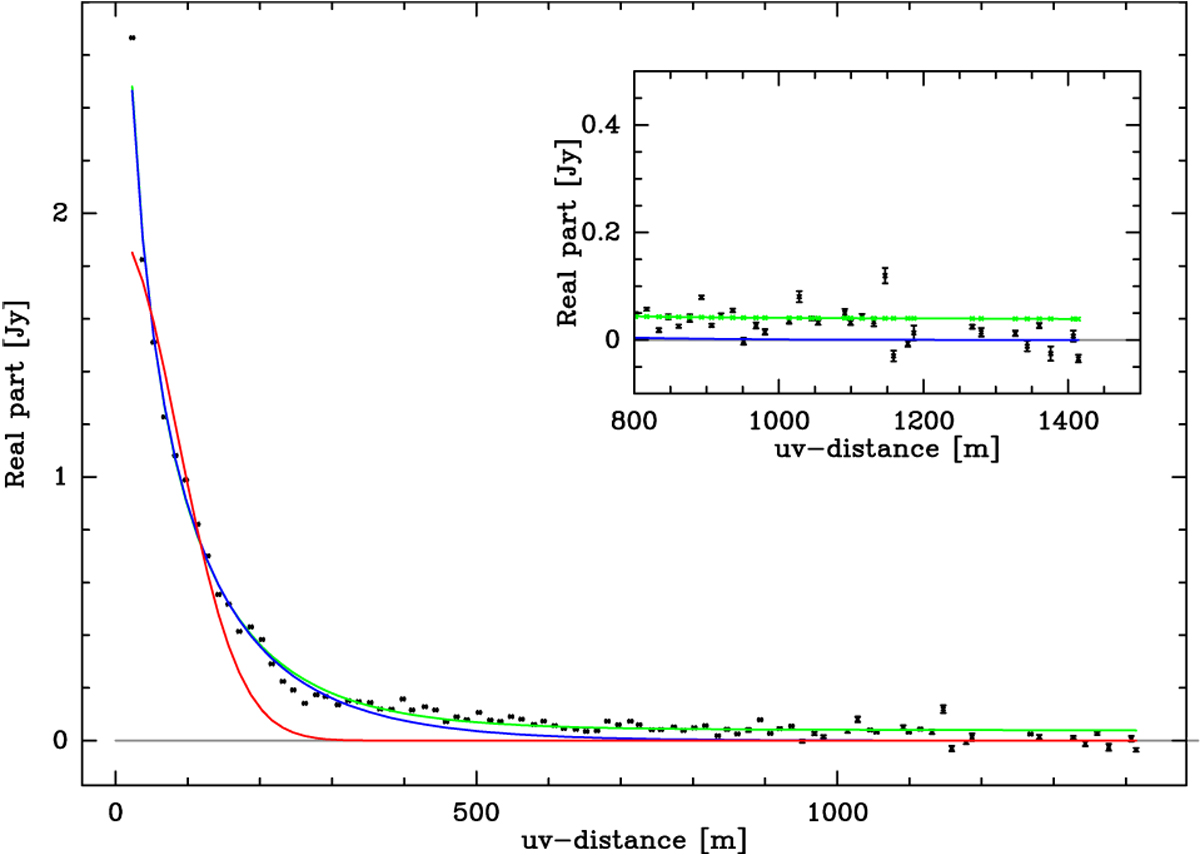
Real part of the visibility measurements vs. uv-distance shown for the ALMA 12 m array data. The data points show an average of line-free channels. The red and blue lines show fits to the envelope, an elliptic Gaussian, and a single component power-law fit, respectively. The green line shows a two-component fit with a power law and a compact disc source (see the text for more details).
Current usage metrics show cumulative count of Article Views (full-text article views including HTML views, PDF and ePub downloads, according to the available data) and Abstracts Views on Vision4Press platform.
Data correspond to usage on the plateform after 2015. The current usage metrics is available 48-96 hours after online publication and is updated daily on week days.
Initial download of the metrics may take a while.