Fig. 2
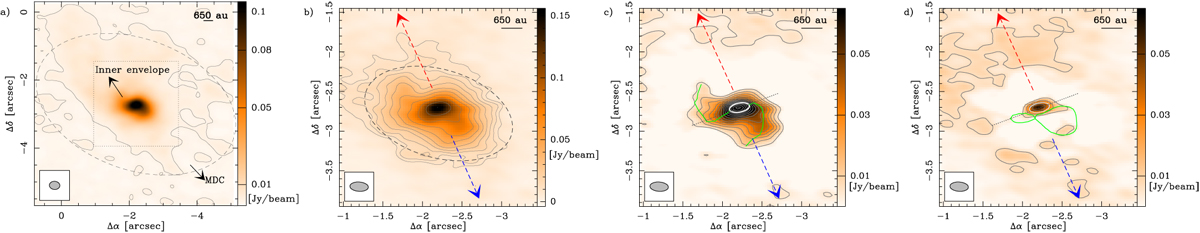
Zoom on Fig. 1 of the protostar centred on Δα = −2.17′′, and Δ δ= −2.76′′ offset from the phase centre. Panel a: continuum emission smoothed to a resolution of 0.27′′, showing the extended emission at the scale of the MDC. The colour scale is linear between − 1 and 105 mJy beam−1, and the contour displays the 1.4 mJy beam−1 level that corresponds to ~5σ. The dashed ellipse shows the FWHM of the MDC from Table 2 adopted from Csengeri et al. (2017b). The region of the inner envelope shown in panels b to c is outlined by a dashed box. The FWHM beam is shown in the lower left corner of all panels. Panel b: line-free continuum emission in the original, unsmoothed 12 m and 7 m array combined map where the beam has a geometric mean of 0.17′′. The colour scale is linear between − 3σ and 120σ, contours start at 7σ and increase on a logarithmic scale up to 120σ by a factor of 1.37. The red and blue dashed lines show the direction of the CO outflow (see Fig. 7 and Sect. 3.4). The dark grey dashed ellipse shows twice the major and minor axes of the fitted 2D Gaussian. Panel c: residual continuum emission after removing a 2D Gaussian with a fixed lower peak intensity from the envelope component in order to enhance the contrast of the inner envelope. The colour scale is linear from 0 to 50σ. The contours start at 3σ and increase by 6σ. The white ellipse shows the FWHM of the fitted 2D Gaussian to the residual from panel b, and the green lineoutlines the azimuthal elongations. The black dotted line marks the direction perpendicular to the outflow. Panel d: residual continuum emission after removing the Gaussian fit to the envelope component (see the text for details). The colour scale is the same as in panel c. Contours start at 5σ and increase by 10σ. Green contours show 80% of the peak of the velocity integrated emission of the 334.436 GHz vt = 1 CH3 OH line shown in Fig. 4.
Current usage metrics show cumulative count of Article Views (full-text article views including HTML views, PDF and ePub downloads, according to the available data) and Abstracts Views on Vision4Press platform.
Data correspond to usage on the plateform after 2015. The current usage metrics is available 48-96 hours after online publication and is updated daily on week days.
Initial download of the metrics may take a while.