Fig. A.2
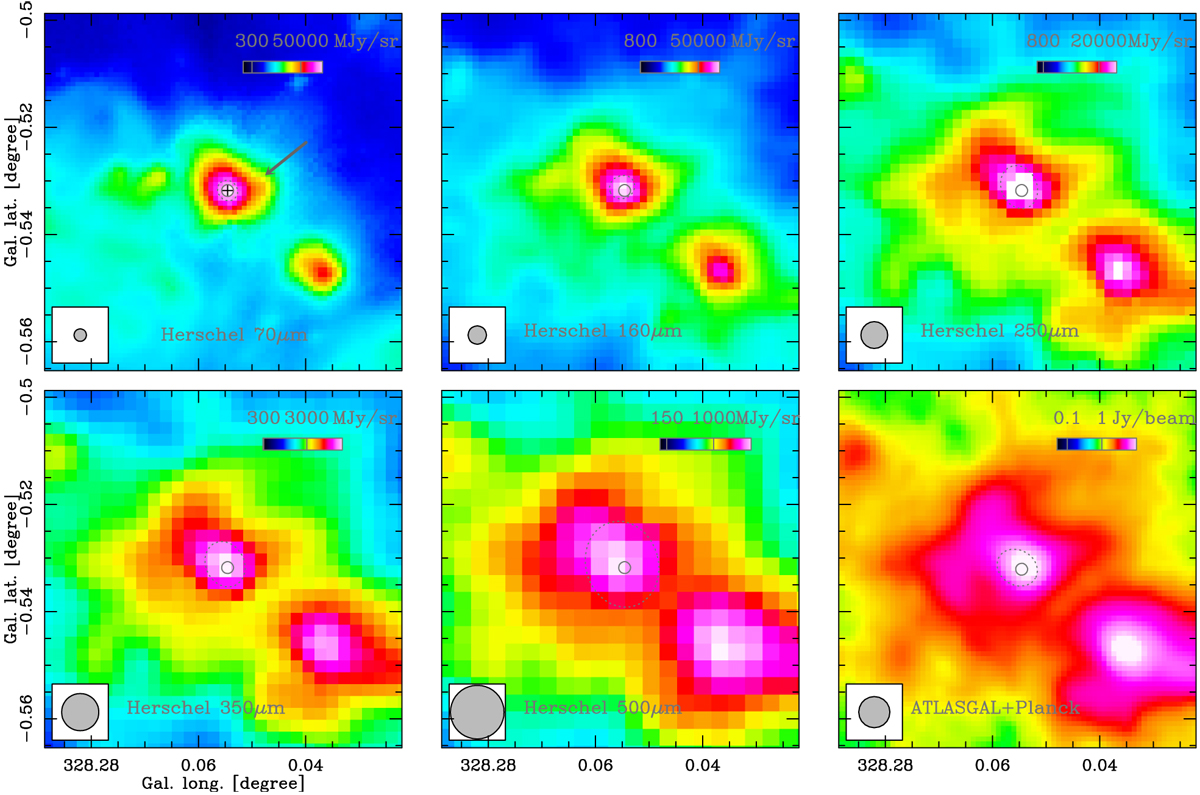
Far-infrared multi-wavelength view of the ATLASGAL clump, G328.2551–0.5321, using the Herschel Hi-GAL images (Molinari et al. 2016), and the APEX/LABOCA and Planck combined maps (Csengeri et al. 2016). The position of the identified source is marked with a black cross, dotted grey ellipses show the corresponding sources from the Hi-GAL and ATLASGAL catalogues (Csengeri et al. 2014; Molinari et al. 2016, respectively). The solid circle shows half the 8′′ FWHM, corresponding to the scale of the MDC. The FWHM beam widths are shown in the lower left corner of each panel. The colour scale is on a logarithmic scale, and the black line shows the labelled flux density value.
Current usage metrics show cumulative count of Article Views (full-text article views including HTML views, PDF and ePub downloads, according to the available data) and Abstracts Views on Vision4Press platform.
Data correspond to usage on the plateform after 2015. The current usage metrics is available 48-96 hours after online publication and is updated daily on week days.
Initial download of the metrics may take a while.