Fig. 11
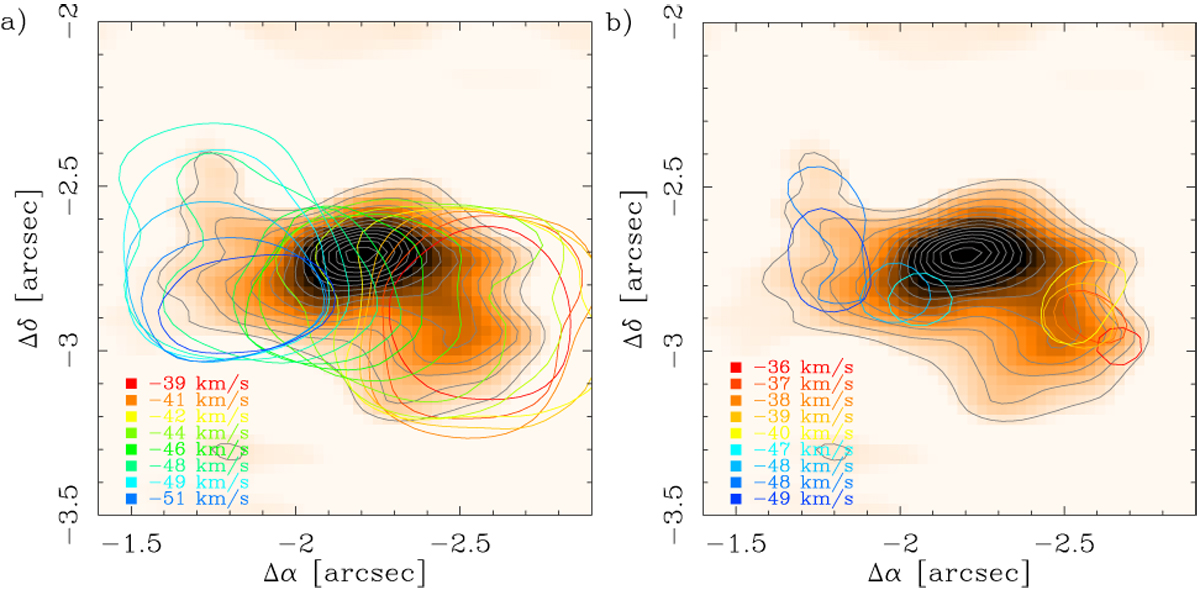
Panel a: same colour scale as in Fig. 2c, showing the thermal dust emission without the larger scale core emission in order to enhance the structure of the inner envelope. The colour lines show the 50% contour of the peak emission of vt = 1 CH3 OH line at different velocities, starting from − 50.5 km s−1 (blue) to − 38 km s−1 (red). The corresponding velocity of every second contour is shown in the figure legend. Panel b: same as the left panel, but showing the90% contours of the most extreme velocity components in red and blue. The velocities corresponding to each contour are shown in the figure legend.
Current usage metrics show cumulative count of Article Views (full-text article views including HTML views, PDF and ePub downloads, according to the available data) and Abstracts Views on Vision4Press platform.
Data correspond to usage on the plateform after 2015. The current usage metrics is available 48-96 hours after online publication and is updated daily on week days.
Initial download of the metrics may take a while.